After completing the MuSiCWang et al. 2019 deconvolution tutorial, you are hopefully excited to apply this analysis to data of your choice. Annoyingly, getting data in the right format is often what prevents us from being able to successfully apply analyses. This tutorial is all about reformatting a raw scRNA-seq dataset pulled from a public resource (the EMBL-EBI single cell expression atlas Moreno et al. 2021. Let’s get started!
First, we will tackle the metadata. We are roughly following the same concept as in the previous bulk deconvolution tutorial, by comparing human pancreas data across a disease variable (type II diabetes vs healthy), but using public datasets to do it.
Find the data
We explored the single cell expression atlas, browsing experiments in order to find a pancreas dataset (Segerstolpe et al. 2016). You can explore this dataset using their browser. These cells come from 6 healthy individuals and 4 individuals with Type II diabetes, so we will create reference Expression Set objects for the total as well as separating out by phenotype, as you may have reason to do this in your analysis (or you may not!).
Tools are frequently updated to new versions. Your Galaxy may have multiple versions of the same tool available. By default, you will be shown the latest version of the tool. This may NOT be the same tool used in the tutorial you are accessing. Furthermore, if you use a newer tool in one step, and try using an older tool in the next step… this may fail! To ensure you use the same tool versions of a given tutorial, use the Tutorial mode feature.
Open your Galaxy server
Click on the curriculum icon on the top menu, this will open the GTN inside Galaxy.
Navigate to your tutorial
Tool names in tutorials will be blue buttons that open the correct tool for you
Note: this does not work for all tutorials (yet)
You can click anywhere in the grey-ed out area outside of the tutorial box to return back to the Galaxy analytical interface
Warning: Not all browsers work!
We’ve had some issues with Tutorial mode on Safari for Mac users.
Try a different browser if you aren’t seeing the button.
Galaxy has a specific tool for ingesting data from the Single cell expression atlas, so there are no uploads for this tutorial.
Hands On: Data retrieval
EBI SCXA Data Retrieval ( Galaxy version v0.0.2+galaxy2) with the following parameters:
“SC-Atlas experiment accession”: E-MTAB-5061
Data management is going to be key in this analysis, so trust me now to start adding tags.
Add to the EBI SCXA Data Retrieval on E-MTAB-5061 exp_design.tsv file the following tags: #ebi #metadata #singlecell
Datasets can be tagged. This simplifies the tracking of datasets across the Galaxy interface. Tags can contain any combination of letters or numbers but cannot contain spaces.
To tag a dataset:
Click on the dataset to expand it
Click on Add Tagsgalaxy-tags
Add tag text. Tags starting with # will be automatically propagated to the outputs of tools using this dataset (see below).
Press Enter
Check that the tag appears below the dataset name
Tags beginning with # are special!
They are called Name tags. The unique feature of these tags is that they propagate: if a dataset is labelled with a name tag, all derivatives (children) of this dataset will automatically inherit this tag (see below). The figure below explains why this is so useful. Consider the following analysis (numbers in parenthesis correspond to dataset numbers in the figure below):
a set of forward and reverse reads (datasets 1 and 2) is mapped against a reference using Bowtie2 generating dataset 3;
dataset 3 is used to calculate read coverage using BedTools Genome Coverageseparately for + and - strands. This generates two datasets (4 and 5 for plus and minus, respectively);
datasets 4 and 5 are used as inputs to Macs2 broadCall datasets generating datasets 6 and 8;
datasets 6 and 8 are intersected with coordinates of genes (dataset 9) using BedTools Intersect generating datasets 10 and 11.
Now consider that this analysis is done without name tags. This is shown on the left side of the figure. It is hard to trace which datasets contain “plus” data versus “minus” data. For example, does dataset 10 contain “plus” data or “minus” data? Probably “minus” but are you sure? In the case of a small history like the one shown here, it is possible to trace this manually but as the size of a history grows it will become very challenging.
The right side of the figure shows exactly the same analysis, but using name tags. When the analysis was conducted datasets 4 and 5 were tagged with #plus and #minus, respectively. When they were used as inputs to Macs2 resulting datasets 6 and 8 automatically inherited them and so on… As a result it is straightforward to trace both branches (plus and minus) of this analysis.
This tool will retrieve four files: a barcodes list, a genes list, an experimental design file, and a matrix market format (where columns refer to genes, cells, and quantities). We (mostly) only need the experimental design file, but keep in mind this will have data on all the cells reported by the authors.
Question
How many cells are in the sample?
How many cells were submitted by the authors?
If you select the param-filebarcodes.tsv file, you’ll find that it contains 2914 lines - this corresponds to the 2914 cells, because each cell is given a barcode.
The nature of public repositories is that they ingest data from many places, which means they usually apply a uniform analysis to samples. This rarely means they yield the same cell numbers as the original authors. If you check the param-fileexp_design.tsv file, which refers to the data submitted by the authors, you’ll find it contains 3514 lines - referring to 3514 cells submitted by authors. It’s important to know that (currently) these files differ.
Prepare the experimental design file
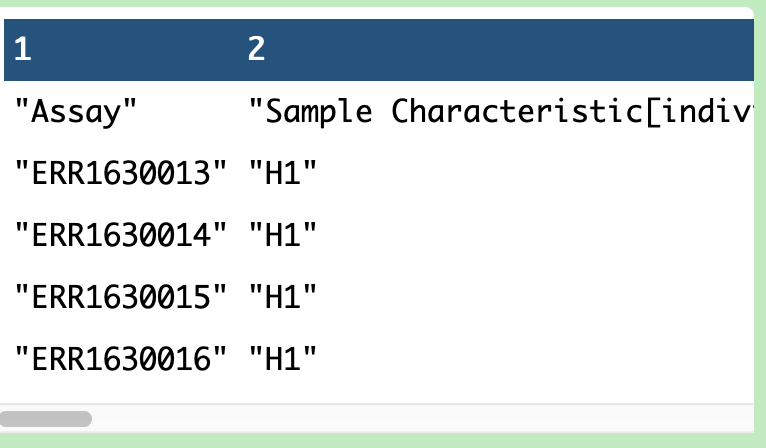
Let’s get rid of a bunch of repetitive columns in the metadata we don’t need. You can find out what each column is by inspecting the dataset galaxy-eye in the history window.
Now, there might be a better way to do this in Galaxy (or you might consider downloading the file locally and changing it in a spreadsheet application or something), but this is what will work to reformat all that annoying text.
Hands On: Reformatting the metadata
Regex Find And Replace ( Galaxy version 1.0.2) with the following parameters:
param-file“Select lines from”: out_file1 (output of Cuttool)
“Find Regex”: "Sample Characteristic\[submitted single cell quality\]"
“Replacement”: "Submitted single cell quality"
param-repeat“Insert Check”
“Find Regex”: "Factor Value\[inferred cell type - ontology labels\]"
“Replacement”: Inferred cell type - ontology label
param-repeat“Insert Check”
“Find Regex”: "Factor Value\[inferred cell type - authors labels\]"
“Replacement”: Inferred cell type - author labels
param-repeat“Insert Check”
“Find Regex”: ""
“Replacement”:
param-repeat“Insert Check”
“Find Regex”: "
“Replacement”:
Comment
What’s with the \ everywhere? That’s because the [] symbols usually call the code to do something, rather than just read it as a normal character. the \ prevents this.
Change the datatype to tabular.
Click on the galaxy-pencilpencil icon for the dataset to edit its attributes
In the central panel, click galaxy-chart-select-dataDatatypes tab on the top
In the galaxy-chart-select-dataAssign Datatype, select tabular from “New Type” dropdown
Tip: you can start typing the datatype into the field to filter the dropdown menu
Click the Save button
Great, this file is now ready to go! But, it contains all those extra cells that didn’t pass filtration with the EBI pipeline and therefore won’t exist in the matrix. We need to remove them for future steps to work. We can use our barcodes list to remove the extra cells.
Prepare the barcodes file
Hands On: Adding a header
Add line to file ( Galaxy version 0.1.0) with the following parameters:
“text to add”: Cell
param-file“input file”: barcode_tsv (output of EBI SCXA Data Retrievaltool)
Change the datatype to tabular.
Click on the galaxy-pencilpencil icon for the dataset to edit its attributes
In the central panel, click galaxy-chart-select-dataDatatypes tab on the top
In the galaxy-chart-select-dataAssign Datatype, select tabular from “New Type” dropdown
Tip: you can start typing the datatype into the field to filter the dropdown menu
Click the Save button
Comment
This is an annoying step we have to do to get the right format, otherwise future steps won’t work.
Use the barcodes list to filter out cells in the experimental design file
Hands On: Joining datasets
Join two Datasets with the following parameters:
param-file“Join”: outfile (output of Add line to filetool)
“using column”: c1
param-file“with”: out_file1 (output of Regex Find And Replacetool)
“and column”: c1
“Fill empty columns”: No
“Keep the header lines”: Yes
Comment
Make sure that you join the files in the same order as above - put the output of Add line to file in first - otherwise your columns will be in a different order for the next step. Everything will still work, but you would need to change the number of the column you remove using Advanced Cut.
Question
How many cells are now in your table?
Is your table ready to go?
If you select the output dataset in your history, you will find 2915 lines, corresponding to 2914 cells and a header. Success!
Not quite - notice how you have two identical columns Cell and Assay? Let’s get rid of one.
Hands On: Remove duplicate columns
Advanced Cut ( Galaxy version 1.1.0) with the following parameters:
param-file“File to cut”: out_file1 (output of Join two Datasetstool)
“Operation”: Discard
“Cut by”: fields
“List of Fields”: c1
Comment
Advanced cut works slightly differently in a workflow versus running the tool independently. Independently, there is a list and you can click through the list to note your columns, while in a workflow it appears as a text option and you put each column on a different line. The point is, each number above represents a column, so remove them!
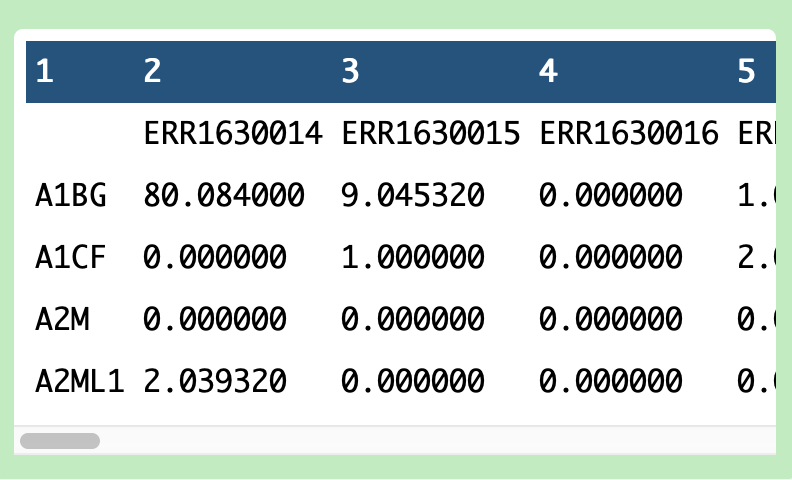
Fantastic! You’ve completed part 1 - making the single cell metadata file. It should now look like this:
Currently, the matrix data is in a 3-column format common in 10x outputs, where you need the barcodes and the genes files to interpret the matrix. What you actually need is an expression matrix with cells on one axis and genes on another. While we aren’t running a Scanpy analysis, we can still use our Scanpy tools to get this format.
Reformat the matrix
Hands On: Task description
Scanpy Read10x ( Galaxy version 1.8.1+galaxy0) with the following parameters:
param-file“Expression matrix in sparse matrix format (.mtx)”: matrix_mtx (output of EBI SCXA Data Retrievaltool)
param-file“Gene table”: genes_tsv (output of EBI SCXA Data Retrievaltool)
param-file“Barcode/cell table”: barcode_tsv (output of EBI SCXA Data Retrievaltool)
“Format of output object”: AnnData format (h5 for older versions)
Change the datatype to h5ad
Click on the galaxy-pencilpencil icon for the dataset to edit its attributes
In the central panel, click galaxy-chart-select-dataDatatypes tab on the top
In the galaxy-chart-select-dataAssign Datatype, select h5ad from “New Type” dropdown
Tip: you can start typing the datatype into the field to filter the dropdown menu
Click the Save button
Now your precious matrix is stored in the 10x AnnData object. Let’s retrieve it!
Hands On: Inspect the matrix
Inspect AnnData ( Galaxy version 0.7.5+galaxy1) with the following parameters:
param-file“Annotated data matrix”: output_h5 (output of Scanpy Read10xtool)
“What to inspect?”: The full data matrix
Question
Which are currently the rows in your matrix, cells or genes?
You may remember from earlier that the sample should have 2914 cells in it. If you inspect the dataset in your history, you will find that it contains 2915 lines (1 for the header), which means that rows correspond to cells. Unfortunately… that’s not what you need.
Hands On: Transpose the matrix
Transpose ( Galaxy version 1.1.0+galaxy2) with the following parameters:
param-file“Input tabular dataset”: X (output of Inspect AnnDatatool)
Question
How many genes are in your sample?
You should have 30,416 lines in it, meaning your sample has 30,415 genes.
Collapse EnsemblIDs
Ok, real talk here. Technically, the best way of analysing anything is by using the EnsemblIDs for any given RNA transcript, because they are more specific than gene names and also cover more of the transcriptome than our gene names…
But…
As biologists, it’s very difficult to interpret ENSIDs. And it’s an awful shame to get to the end of the MuSiC deconvolution and have all our plots show sad ENS IDs. So, courtesy of the excellent @mtekman, we steal his workflow to collapse the ENS IDs into gene names.
Click on galaxy-workflows-activityWorkflows in the Galaxy activity bar (on the left side of the screen, or in the top menu bar of older Galaxy instances). You will see a list of all your workflows
Click on galaxy-uploadImport at the top-right of the screen
Provide your workflow
Option 1: Paste the URL of the workflow into the box labelled “Archived Workflow URL”
Option 2: Upload the workflow file in the box labelled “Archived Workflow File”
Click the Import workflow button
Below is a short video demonstrating how to import a workflow from GitHub using this procedure:
Video: Importing a workflow from URL
Run the workflow on your sample with the following parameters:
“Organism”: Human
param-file“Expression Matrix (Gene Rows)”: output_h5 (output of Transposetool)
Click on Workflows on the Activity Bar on the left.
At the top of the resulting page you will have the option to switch between the My workflows, Workflows shared with me and Public workflows tabs.
Select the tab you want to see all workflows in that category
Search for your desired workflow.
Click on the workflow name: a pop-up window opens with a preview of the workflow.
To run it directly: click Run (top-right).
Recommended: click Import (left of Run) to make your own local copy under Workflows / My Workflows.
The output will likely be called Text transformation and will look like this:
Figure 4: Output of the ENS ID collapsing workflow
Construct Expression Set Objects
We’re nearly there! We have three more tasks to do: first, we need to create the expression set object with all the phenotypes combined. Then, we also want to create two separate objects - one for healthy and one for diseased as references.
Hands On: Creating the combined object
Construct Expression Set Object ( Galaxy version 0.1.1+galaxy4) with the following parameters:
param-file“Assay Data”: out_file #matrix (output of Text transformationtool)
param-file“Phenotype Data”: output (output of Advanced Cuttool)
Remove the #metadata #matrix tags from the output RData ESet Object
Add the tag #combined to the output RData ESet Object
Question
How many genes are in your sample now?
If you select the galaxy-eye of the output General Info dataset in the history, you will find it contains 21671 features and 2914 samples, or rather, 21671 genes and 2914 cells. That’s a huge reduction in genes thanks to the ENS ID collapsing!
Hands On: Creating the disease-only object
Manipulate Expression Set Object ( Galaxy version 0.1.1+galaxy4) with the following parameters:
param-file“Expression Set Dataset”: out_rds (output of Construct Expression Set Objecttool)
“Concatenate other Expression Set objects?”: No
“Subset the dataset?”: Yes
“By”: Filter Samples and Genes by Phenotype Values
In “Filter Samples by Condition”:
param-repeat“Insert Filter Samples by Condition”
“Name of phenotype column”: Disease
“List of values in this column to filter for, comma-delimited”: type II diabetes mellitus
Remove the #combined tag from the output RData ESet Object
Add the tag #T2D to the output RData ESet Object
You can either re-run this tool or set it up again to create the healthy-only object.
Hands On: Creating the healthy-only object
Manipulate Expression Set Object ( Galaxy version 0.1.1+galaxy4) with the following parameters:
param-file“Expression Set Dataset”: out_rds (output of Construct Expression Set Objecttool)
“Concatenate other Expression Set objects?”: No
“Subset the dataset?”: Yes
“By”: Filter Samples and Genes by Phenotype Values
In “Filter Samples by Condition”:
param-repeat“Insert Filter Samples by Condition”
“Name of phenotype column”: Disease
“List of values in this column to filter for, comma-delimited”: normal
Remove the #combined tag from the output RData ESet Object
Add the tag #healthy to the output RData ESet Object
Question
Why are you making a healthy-only and diseased-only reference objects?
We could imagine that the cells will express different transcript levels, but that the deconvolution tools will have to take some sort of average. Perhaps it might be more accurate to infer like from like, i.e. healthy from healthy? Or perhaps that is skewing the data through a more ‘supervised’ approach. We’re not quite sure, and it likely depends on the biology, so we’re covering all our bases by making sure you can do this every way. (We’ve tested it on our dataset in all the ways and got the same results, so it doesn’t make much of a difference as far as we can tell!)
Figure 7: Subworkflow: Collapsing the Ensembl IDs into gene names
With these workflows, you’ve created three Expression Set objects, capable of running in the MuSiC Compare tutorial. Now you just need the bulk RNA-seq Expression Set objects!
We also post new tutorials / workflows there from time to time, as well as any other news.
point-right If you’d like to contribute ideas, requests or feedback as part of the wider community building single-cell and spatial resources within Galaxy, you can also join our Single cell & sPatial Omics Community of Practice.
Further information, including links to documentation and original publications, regarding the tools, analysis techniques and the interpretation of results described in this tutorial can be found here.
References
Segerstolpe, Å., A. Palasantza, P. Eliasson, E.-M. Andersson, A.-C. Andréasson et al., 2016 Single-cell transcriptome profiling of human pancreatic islets in health and type 2 diabetes. Cell metabolism 24: 593–607. 10.1016/j.cmet.2016.08.020
Wang, X., J. Park, K. Susztak, N. R. Zhang, and M. Li, 2019 Bulk tissue cell type deconvolution with multi-subject single-cell expression reference. Nature communications 10: 1–9. 10.1038/s41467-018-08023-x
Moreno, P., S. Fexova, N. George, J. R. Manning, Z. Miao et al., 2021 Expression Atlas update: gene and protein expression in multiple species. Nucleic Acids Research 50: D129–D140. 10.1093/nar/gkab1030
Feedback
Did you use this material as an instructor? Feel free to give us feedback on how it went.
Did you use this material as a learner or student? Click the form below to leave feedback.
Hiltemann, Saskia, Rasche, Helena et al., 2023 Galaxy Training: A Powerful Framework for Teaching! PLOS Computational Biology 10.1371/journal.pcbi.1010752
Batut et al., 2018 Community-Driven Data Analysis Training for Biology Cell Systems 10.1016/j.cels.2018.05.012
@misc{single-cell-bulk-music-2-preparescref,
author = "Wendi Bacon and Mehmet Tekman",
	title = "Matrix Exchange Format to ESet | Creating a single-cell RNA-seq reference dataset for deconvolution (Galaxy Training Materials)",
	year = "",
	month = "",
	day = "",
	url = "\url{https://training.galaxyproject.org/training-material/topics/single-cell/tutorials/bulk-music-2-preparescref/tutorial.html}",
	note = "[Online; accessed TODAY]"
}
@article{Hiltemann_2023,
	doi = {10.1371/journal.pcbi.1010752},
	url = {https://doi.org/10.1371%2Fjournal.pcbi.1010752},
	year = 2023,
	month = {jan},
	publisher = {Public Library of Science ({PLoS})},
	volume = {19},
	number = {1},
	pages = {e1010752},
	author = {Saskia Hiltemann and Helena Rasche and Simon Gladman and Hans-Rudolf Hotz and Delphine Larivi{\`{e}}re and Daniel Blankenberg and Pratik D. Jagtap and Thomas Wollmann and Anthony Bretaudeau and Nadia Gou{\'{e}} and Timothy J. Griffin and Coline Royaux and Yvan Le Bras and Subina Mehta and Anna Syme and Frederik Coppens and Bert Droesbeke and Nicola Soranzo and Wendi Bacon and Fotis Psomopoulos and Crist{\'{o}}bal Gallardo-Alba and John Davis and Melanie Christine Föll and Matthias Fahrner and Maria A. Doyle and Beatriz Serrano-Solano and Anne Claire Fouilloux and Peter van Heusden and Wolfgang Maier and Dave Clements and Florian Heyl and Björn Grüning and B{\'{e}}r{\'{e}}nice Batut and},
	editor = {Francis Ouellette},
	title = {Galaxy Training: A powerful framework for teaching!},
	journal = {PLoS Comput Biol}
}
Congratulations on successfully completing this tutorial!
Do you want to extend your knowledge?
Follow one of our recommended follow-up trainings:
Questions:

 Open image in new tab
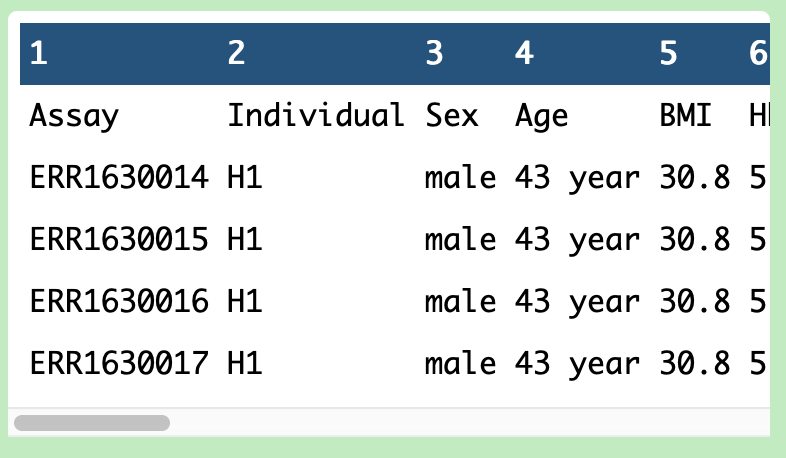 Open image in new tab
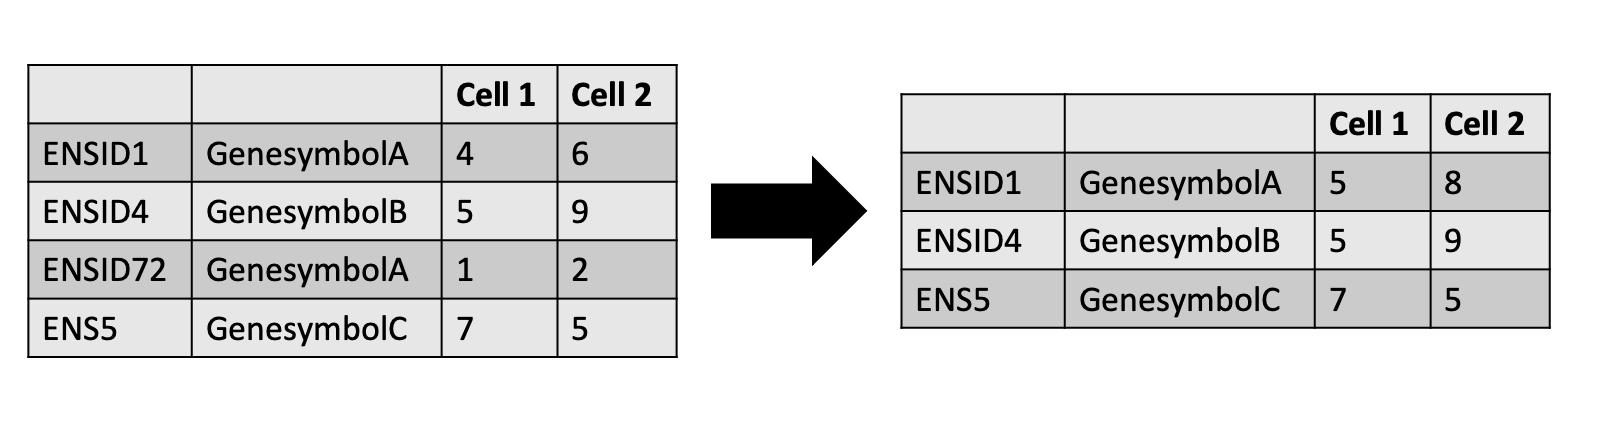 Open image in new tab
 Open image in new tab
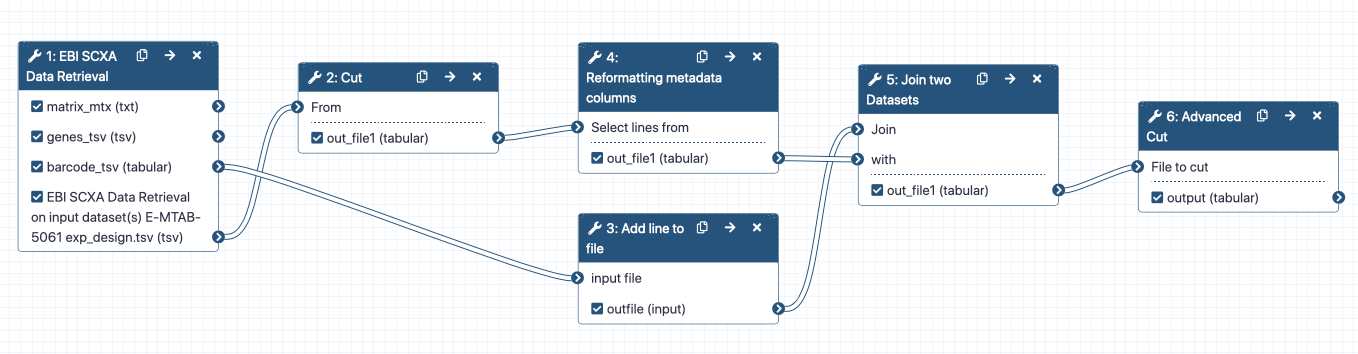 Open image in new tab
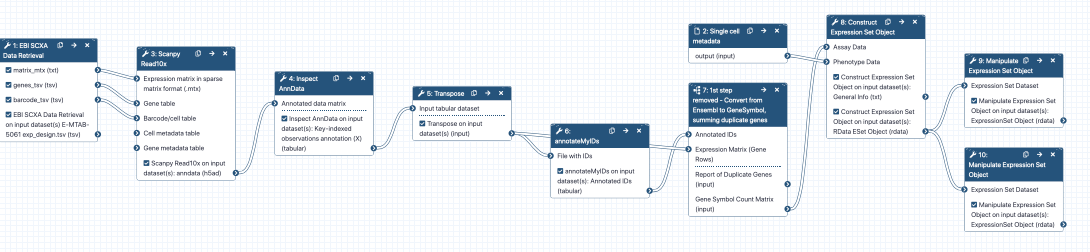 Open image in new tab
 Open image in new tab