The goal of this tutorial is to take raw NCBI data from some published research, convert the raw data into the AnnData format then add metadata to the object so that it can be used for further processing / analysis. Here we will look at the steps to obtain, understand, and manipulate the data in order for it to be properly processed.
The NCBI Database is a large repository for storing and accessing various types of biological data such as genome sequences, protein sequences, academic literature, etc. NCBI is a invaluable tool used for researchers and scientists, as a result it is important to know how to understand and utilise NCBI’s data resources.
Obtaining the Data
The first step is the obtain the data. For this tutorial, we will use data from the paper Song et al. 2022. The data for this research is stored in the Gene Expression Omnibus (GEO).
Hands-on: Choose Your Own Tutorial
This is a 'Choose Your Own Tutorial' (CYOT) section (also known as 'Choose Your Own Analysis' (CYOA)), where you can select between multiple paths. Click one of the buttons below to select how you want to follow the tutorial
If you have experience finding and downloading data from GEO then you can use the Zenodo link to load the data directly into Galaxy, if you don’t have experience with GEO then you can manually download, prepare, and load the data into Galaxy.
Hands On: Download and extract the data from GEO
Using a web browser navigate to the GEO repository for the paper
Click galaxy-uploadUpload at the top of the activity panel
Select galaxy-wf-editPaste/Fetch Data
Paste the link(s) into the text field
Press Start
Close the window
Check that the datatype is tabular
Click on the galaxy-pencilpencil icon for the dataset to edit its attributes
In the central panel, click galaxy-chart-select-dataDatatypes tab on the top
In the galaxy-chart-select-dataAssign Datatype, select tabular from “New Type” dropdown
Tip: you can start typing the datatype into the field to filter the dropdown menu
Click the Save button
We now have the raw gene expression data that we will process. However, we will need to manually add some metadata, which requires finding out some more information about our files.
Downloading the paper and looking under Methods we can see that there are 2 biopsy samples for patients 1-3. For this tutorial we will be processing the first 3 patient’s data, therefore we will need to find more information about the biopsy samples.
On the NCBI page containing the paper we can scroll down to see a Supplementary Materials section. Under this section we should see various .xlsx files (Excel spreadsheets). These will contain metadata about the work done in the paper.
Looking through each file we can eventually find the spreadsheet 41467_2021_27322_MOESM2_ESM.xlsx which contains information about each patient including the biopsy sample IDs and tumor specimens. So we will want to download this in order to extract out the required information!
This one spreadsheet contains all the information we need to further understand our data.
Understanding the Data
If we look at that excel file 41467_2021_27322_MOESM2_ESM.xlsx, we can see multiple sheets.
Question
How many different patients are in this study?
Navigating to Clinical_info shows us that the data consists of 11 different patients, with some patients having multiple different samples of different tumor specimens.
For this tutorial, we are only going to process the first 3 patients. A summary of the relevant data can be seen below:
PatientID
Biopsy samples
Tumor Specimen
Patient 1
AUG_PB1A
left-mid
AUG_PB1B
right-mid
Patient 2
MAY_PB1A
right-mid
MAY_PB1B
right-apex
Patient 3
MAY_PB2A
right-anterior
MAY_PB2B
right-mid
We can see that each patient has 2 different samples from different tumor locations. This is important information that needs to be added to our dataset so that we can separate it during analysis, if needed.
Unfortunately, the names of the files don’t exactly match the data in our excel sheet. This can make finding the right samples a bit difficult! A summary of which samples match which file can be found below:
AUG_PB1A —> PA_AUG_PB_1A
AUG_PB1B —> PA_AUG_PB_1B
MAY_PB1A —> PA_PB1A
MAY_PB1B —> PA_PB1B
MAY_PB2A —> PA_PB2A
MAY_PB2B —> PA_PB2B
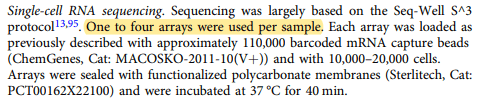
You may also notice that we have multiple sample files with the same name suffixed with _Pool_X. These are replicates, where multiple samples are taken of the same tumor area in order to get a more comprehensive view of the gene data of the tumor. We will need to combine these replicates during processing.
These replicate files can be confirmed by looking under the Methods section of the paper where it states that one to four arrays were used per sample.
We now need to find the files relating to each patient. Selecting the output param-fileUnzip tool shows you 53 files in a param-collection dataset collection. We will work with the 10 files associated with our target patients.
Hands On: Unhiding 10 target files
In the galaxy-history Galaxy history panel, select the Include hidden icon galaxy-show-hidden to see the 53 files in your dataset collection.
Scroll down to visualise the following 10 samples (likely in opposite order to this!):
For each of those 10 samples, select the Unhide icon galaxy-show-hidden. This will move them from galaxy-show-hiddenHidden to Active.
Navigate back to the galaxy-show-activeActive datasets list, where you will now see your 10 target samples.
In the galaxy-history Galaxy history panel, click the galaxy-selectorSelect items to allow you to select multiple datasets from your history
Select all 10 samples
Select the highlighted rectangle 10 of X (the X may be different depending on what you’ve imported!) to give you a menu, from which you select Change data type
Select the dropdown menu and either type in or scroll to find tabular.gz
Creating the AnnData object
The next step is to convert all of the raw files into AnnData objects, this can be done one at a time or all at once by selecting multiple datasets when choosing the input and highlighting all the raw data files.
Before starting to process the data, it is generally a good idea to add tags to each sample in order to keep track of what data is being processed. Below is some of the imported data with added tags for the patient and sample id. We suggest you replicate this in your history.
Datasets can be tagged. This simplifies the tracking of datasets across the Galaxy interface. Tags can contain any combination of letters or numbers but cannot contain spaces.
To tag a dataset:
Click on the dataset to expand it
Click on Add Tagsgalaxy-tags
Add tag text. Tags starting with # will be automatically propagated to the outputs of tools using this dataset (see below).
Press Enter
Check that the tag appears below the dataset name
Tags beginning with # are special!
They are called Name tags. The unique feature of these tags is that they propagate: if a dataset is labelled with a name tag, all derivatives (children) of this dataset will automatically inherit this tag (see below). The figure below explains why this is so useful. Consider the following analysis (numbers in parenthesis correspond to dataset numbers in the figure below):
a set of forward and reverse reads (datasets 1 and 2) is mapped against a reference using Bowtie2 generating dataset 3;
dataset 3 is used to calculate read coverage using BedTools Genome Coverageseparately for + and - strands. This generates two datasets (4 and 5 for plus and minus, respectively);
datasets 4 and 5 are used as inputs to Macs2 broadCall datasets generating datasets 6 and 8;
datasets 6 and 8 are intersected with coordinates of genes (dataset 9) using BedTools Intersect generating datasets 10 and 11.
Now consider that this analysis is done without name tags. This is shown on the left side of the figure. It is hard to trace which datasets contain “plus” data versus “minus” data. For example, does dataset 10 contain “plus” data or “minus” data? Probably “minus” but are you sure? In the case of a small history like the one shown here, it is possible to trace this manually but as the size of a history grows it will become very challenging.
The right side of the figure shows exactly the same analysis, but using name tags. When the analysis was conducted datasets 4 and 5 were tagged with #plus and #minus, respectively. When they were used as inputs to Macs2 resulting datasets 6 and 8 automatically inherited them and so on… As a result it is straightforward to trace both branches (plus and minus) of this analysis.
Import Anndata ( Galaxy version 0.10.9+galaxy0) with the following parameters:
“Create anndata from”: Tabular, CSV, TSV
“Annotated data matrix”
param-filesMultiple datasets: Select all imported files
“Does the first column store the row names?”: Yes
Inspect AnnData ( Galaxy version 0.10.9+galaxy0) with the following parameters:
param-file“Annotated data matrix”: select any one of the AnnData files
“What to inspect?”: Key-indexed observations annotation (obs)
Examine galaxy-eye the param-file“Inspect AnnData” output. You will find a list of genes - however, the obs (observations) layer in the AnnData object should store cell data. The var (variables) should store the genes data. We need to transpose all of our AnnData objects. We will speed up the process by selecting all of the AnnData objects and processing them at once.
Comment: Check your data
Whilst for this specific data, the object needed to be transposed, this won’t always be the case! The easiest way is to check the obs data of the AnnData object using the toolInspect AnnData tool. The param-fileobs file should have a column containing short nucleotide sequences (something like CGGAAGTGATAC). If that’s the case, then the data doesn’t need to be transposed, because those are the cell barcodes!
Hands On: Transpose AnnData objects
Manipulate AnnData ( Galaxy version 0.10.9+galaxy0) with the following parameters:
“Annotated data matrix”
param-filesMultiple datasets: Select all AnnData files
“Function to manipulate the object”: Transpose the data matrix, leaving observations and variables interchanged
Now, we have all the AnnData objects with the data in the correct orientation. We can combine them into a single AnnData object, which will make the data easier to work with. This combination operation will add an additional column called batch which tells us which AnnData object each bit of data came from. This will be useful for further processing!
Hands On: Combine AnnData objects
Manipulate AnnData ( Galaxy version 0.10.9+galaxy0) with the following parameters:
param-file“Annotated data matrix”: Select first Manipulate AnnData (transpose) output
“Function to manipulate the object”: Concatenate along the observations axis
param-file“Annotated data matrix to add”: Select all other Manipulate AnnData (transpose) outputs
“Join method”: Intersection of variables
“Key to add the batch annotation to obs”: batch
“Separator to join the existing index names with the batch category”: -
Renamegalaxy-pencil output Combined Object
Now we have all of our gene expression data stored in a single AnnData object! We just need to add our metadata!
Annotating the data
The next step is to annotate our data using the information gathered from the excel sheet earlier. We will do this by leveraging the batch column generated when the objects were combined for each individual patient/sample (indicated by the batch number). We will add in the relevant annotations. First, let’s extract the observation data so we can manipulate it.
Hands On
Inspect AnnData ( Galaxy version 0.10.9+galaxy0) with the following parameters:
param-file“Annotated data matrix”: Combined Object
“What to inspect?”: Key-indexed observations annotation (obs)
Renamegalaxy-pencil output Observation data
For each new column, we need to replace the relevant batch numbers with the appropriate metadata. After that, we can cut the modified column out so it is separated. We will repeat this process for each piece of metadata we want to add. All the relevant data can be found in the first table of this tutorial.
Let’s now add the replicate column which tells us which cells are part of pools of the same patient and tumor location.
Hands On: Create replicate metadata
Replace Text ( Galaxy version 9.3+galaxy1)in a specific column with the following parameters:
param-file“File to process”: Observation data
“1: Replacement”
“in column”: Column: 2
“Find pattern”: 2|4|7|8
“Replace with”: poolA
+ Insert Replacement
“2: Replacement”
“in column”: Column: 2
“Find pattern”: 3|5|9
“Replace with”: poolB
+ Insert Replacement
“3: Replacement”
“in column”: Column: 2
“Find pattern”: 6
“Replace with”: poolC
+ Insert Replacement
“4: Replacement”
“in column”: Column: 2
“Find pattern”: 0|1
“Replace with”: NA
+ Insert Replacement
“5: Replacement”
“in column”: Column: 2
“Find pattern”: batch
“Replace with”: replicate
Cut with the following parameters:
“Cut columns”: c2
“Delimited by”: Tab
param-file“From”: output of Replace Text
Renamegalaxy-pencil output Replicate Metadata
Next we will add the metadata indicating which patient each row came from.
Hands On: Create patient data
Replace Text ( Galaxy version 9.3+galaxy1) with the following parameters:
param-file“File to process”: Observation data
“1: Replacement”
“in column”: Column: 2
“Find pattern”: 0|1
“Replace with”: patient1
+ Insert Replacement
“2: Replacement”
“in column”: Column: 2
“Find pattern”: 2|3|4|5|6
“Replace with”: patient2
+ Insert Replacement
“3: Replacement”
“in column”: Column: 2
“Find pattern”: 7|8|9
“Replace with”: patient3
+ Insert Replacement
“5: Replacement”
“in column”: Column: 2
“Find pattern”: batch
“Replace with”: patient
Cut with the following parameters:
“Cut columns”: c2
“Delimited by”: Tab
param-file“From”: output of Replace Text
Renamegalaxy-pencil output Patient Metadata
We will now add a column to indicate which sample each row came from using the sample ID’s described earlier.
Hands On: Create sample ID metadata
Replace Text ( Galaxy version 9.3+galaxy1) with the following parameters:
param-file“File to process”: Observation data
“1: Replacement”
“in column”: Column: 2
“Find pattern”: 0
“Replace with”: AUG_PB1A
+ Insert Replacement
“2: Replacement”
“in column”: Column: 2
“Find pattern”: 1$
“Replace with”: AUG_PB1B
+ Insert Replacement
“3: Replacement”
“in column”: Column: 2
“Find pattern”: (2$)|3
“Replace with”: MAY_PB1A
+ Insert Replacement
“4: Replacement”
“in column”: Column: 2
“Find pattern”: 4|5|6
“Replace with”: MAY_PB1B
+ Insert Replacement
“5: Replacement”
“in column”: Column: 2
“Find pattern”: 7
“Replace with”: MAY_PB2A
+ Insert Replacement
“6: Replacement”
“in column”: Column: 2
“Find pattern”: 8|9
“Replace with”: MAY_PB2B
+ Insert Replacement
“7: Replacement”
“in column”: Column: 2
“Find pattern”: batch
“Replace with”: specimenID
Cut with the following parameters:
“Cut columns”: c2
“Delimited by”: Tab
param-file“From”: output of Replace Text
Renamegalaxy-pencil output Specimen Metadata
You may have noticed that some of the parameters in the previous tool used the $ symbol. This is due to how the Replace Text tool works. The tool will replace and update the data for every insert operation, meaning that lines that have already been updated could be updated again.
Since we are replacing our batch ID’s with identifiers that include numbers, we want to prevent them from being updated again. Appending the pattern with the $ symbol tells the tool to only replace the pattern if it is not followed by any other character (so the 1 in AUG_PB1A won’t be replaced as it is followed by an ‘A’).
Finally we will add the tumor column which indicates which tumor sample each row belongs to.
Hands On: Create tumor metadata
Replace Text ( Galaxy version 9.3+galaxy1) with the following parameters:
param-file“File to process”: Observation data
“1: Replacement”
“in column”: Column: 2
“Find pattern”: 0
“Replace with”: left-mid
+ Insert Replacement
“2: Replacement”
“in column”: Column: 2
“Find pattern”: 1|2|3|8|9
“Replace with”: right-mid
+ Insert Replacement
“3: Replacement”
“in column”: Column: 2
“Find pattern”: 4|5|6
“Replace with”: right-apex
+ Insert Replacement
“4: Replacement”
“in column”: Column: 2
“Find pattern”: 7
“Replace with”: right-anterior
+ Insert Replacement
“5: Replacement”
“in column”: Column: 2
“Find pattern”: batch
“Replace with”: tumorSpecimen
Cut with the following parameters:
“Cut columns”: c2
“Delimited by”: Tab
param-file“From”: output of Replace Text
Renamegalaxy-pencil output Tumor Metadata
With all the individual metadata columns created, we can now combine them together to make a single tabular file containing our metadata. Since the Paste operation only allows us to combine two columns at once we will need to run the tool a few times to add all the columns together.
Hands On: Combine metadata
Paste with the following parameters:
param-file“Paste”: Replicate Metadata
param-file“and”: Patient Metadata
“Delimit by”: Tab
Paste with the following parameters:
param-file“Paste”: Output of previous Paste
param-file“and”: Specimen Metadata
“Delimit by”: Tab
Paste with the following parameters:
param-file“Paste”: Output of previous Paste
param-file“and”: Tumor Metadata
“Delimit by”: Tab
Renamegalaxy-pencil output Cell Metadata
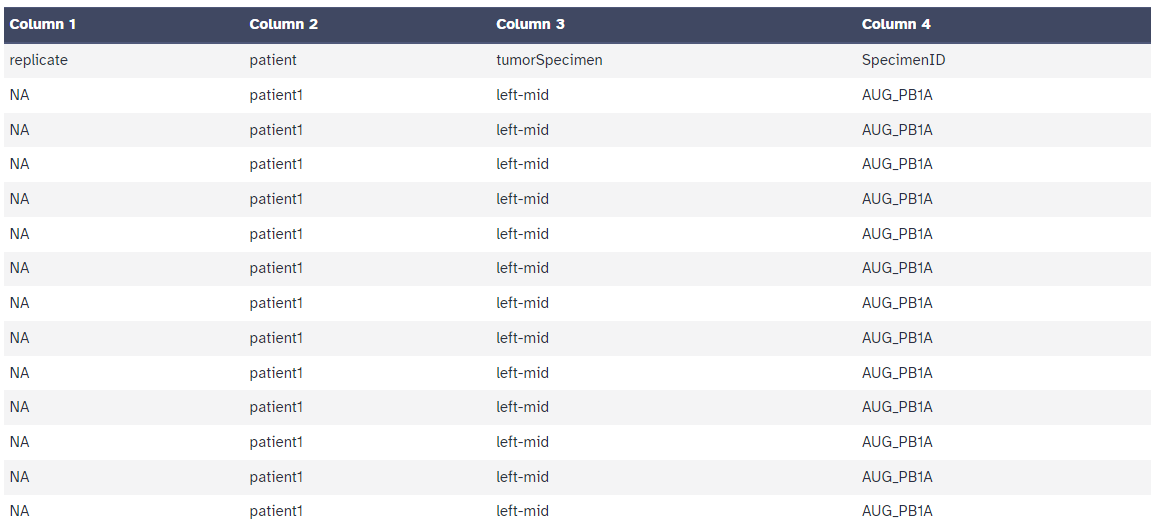
After processing the Cell Metadata table should look like the following:
With the metadata table ready, we can add it to our original combined object!
Hands On: Add metadata to AnnData object
Manipulate AnnData ( Galaxy version 0.10.9+galaxy0) with the following parameters:
param-file“Annotated data matrix”: Combined Object
“Function to manipulate the object”: Add new annotation(s) for observations of variables
“What to annotate?”: Observations (obs)
param-file“Table with new annotations”: Cell Metadata
Renamegalaxy-pencil output Annotated Object
congratulations Congratulations! You have successfully interpreted the milieu of files in a published dataset, transformed the data into a usable format, and added all the relevant annotations to the AnnData object! All that’s left to do is to add some quality control metrics using automated tools!
Adding quality control metrics
With the manual annotations added, we need to do some further processing to add some statistical metadata about the genes. This is done automatically by running two different tools.
First, we will run the Scanpy FilterCells tool without actually filtering. This tool will add some metadata about the counts and numbers of expressed genes.
Hands On: Add initial metadata
Scanpy FilterCells ( Galaxy version 1.9.3+galaxy0) with the following parameters:
param-file“Input object in AnnData/Loom format”: Annotated Object
“Name of the column in anndata.var that contains gene name”: _index
The final tool, toolAnnData Operations, will add the rest of our metadata. This is mostly information about the mitochondrial genes present in the object, roughly counted by flagging genes that start with MT-.
Hands On: Add final metadata
AnnData Operations ( Galaxy version 1.9.3+galaxy0) with the following parameters:
param-file“Input object in hdf5 AnnData format”: Output of Scanpy FilterCells
+ Insert Flag genes that start with these names
“1: Parameters to select cells to keep”
“starts with”: MT-
“Var name”: mito
Renamegalaxy-pencil output Final Object
Inspect AnnData ( Galaxy version 0.10.9+galaxy0) with the following parameters:
param-file“Annotated data matrix”: Final Object
“What to inspect?”: Key-indexed observations annotation (obs)
With that run we should be finished! Check the param-fileobs file to see all the metadata that we’ve added in throughout the tutorial.
Warning: Check your final object!
The above tools will sometimes run without error but not produce the correct results - just because they run doesn’t mean all the parameters and inputs were set properly! When galaxy-eye inspecting the param-fileobs file of the final AnnData object, you should see that all the columns contain data. If any of the columns are blank, then something has gone wrong!
congratulations Congratulations! Now your data is ready for further processing or analysis! You can compare your analysis results with this example history and redo the whole analysis with a single click using this workflow.
You've Finished the Tutorial
Please also consider filling out the Feedback Form as well!
Key points
Single cell data often requires additional processing and conversion before it is able to be analysed.
Metadata and annotations can be added in both manually and automatically with various tools and resources.
Frequently Asked Questions
Have questions about this tutorial? Have a look at the available FAQ pages and support channels
Further information, including links to documentation and original publications, regarding the tools, analysis techniques and the interpretation of results described in this tutorial can be found here.
References
Song, H., H. N. W. Weinstein, P. Allegakoen, M. H. Wadsworth, J. Xie et al., 2022 Single-cell analysis of human primary prostate cancer reveals the heterogeneity of tumor-associated epithelial cell states. Nature Communications 13: 10.1038/s41467-021-27322-4
Feedback
Did you use this material as an instructor? Feel free to give us feedback on how it went.
Did you use this material as a learner or student? Click the form below to leave feedback.
Hiltemann, Saskia, Rasche, Helena et al., 2023 Galaxy Training: A Powerful Framework for Teaching! PLOS Computational Biology 10.1371/journal.pcbi.1010752
Batut et al., 2018 Community-Driven Data Analysis Training for Biology Cell Systems 10.1016/j.cels.2018.05.012
@misc{single-cell-scrna-ncbi-anndata,
author = "Morgan Howells",
	title = "Converting NCBI Data to the AnnData Format (Galaxy Training Materials)",
	year = "",
	month = "",
	day = "",
	url = "\url{https://training.galaxyproject.org/training-material/topics/single-cell/tutorials/scrna-ncbi-anndata/tutorial.html}",
	note = "[Online; accessed TODAY]"
}
@article{Hiltemann_2023,
	doi = {10.1371/journal.pcbi.1010752},
	url = {https://doi.org/10.1371%2Fjournal.pcbi.1010752},
	year = 2023,
	month = {jan},
	publisher = {Public Library of Science ({PLoS})},
	volume = {19},
	number = {1},
	pages = {e1010752},
	author = {Saskia Hiltemann and Helena Rasche and Simon Gladman and Hans-Rudolf Hotz and Delphine Larivi{\`{e}}re and Daniel Blankenberg and Pratik D. Jagtap and Thomas Wollmann and Anthony Bretaudeau and Nadia Gou{\'{e}} and Timothy J. Griffin and Coline Royaux and Yvan Le Bras and Subina Mehta and Anna Syme and Frederik Coppens and Bert Droesbeke and Nicola Soranzo and Wendi Bacon and Fotis Psomopoulos and Crist{\'{o}}bal Gallardo-Alba and John Davis and Melanie Christine Föll and Matthias Fahrner and Maria A. Doyle and Beatriz Serrano-Solano and Anne Claire Fouilloux and Peter van Heusden and Wolfgang Maier and Dave Clements and Florian Heyl and Björn Grüning and B{\'{e}}r{\'{e}}nice Batut and},
	editor = {Francis Ouellette},
	title = {Galaxy Training: A powerful framework for teaching!},
	journal = {PLoS Comput Biol}
}
Funding
These individuals or organisations provided funding support for the development of this resource
Questions:

Open image in new tab
Open image in new tab
 Open image in new tab
Open image in new tab

 Open image in new tab