Scanpy Parameter Iterator
| Author(s) |
|
| Tester(s) |
|
| Reviewers |
|
OverviewQuestions:
Objectives:
How can I run a tool with multiple parameter values?
Do I have to enter parameter values manually each time I want to check a new value?
What tools can take multiple values at once and iterate over them?
Requirements:
Execute the Scanpy Parameter Iterator
Recognise what tools you can use Parameter Iterator with
Operate tools working on dataset collections
Compare plots resulting from different parameters values
- Introduction to Galaxy Analyses
- tutorial Hands-on: Generating a single cell matrix using Alevin
- tutorial Hands-on: Combining single cell datasets after pre-processing
- tutorial Hands-on: Filter, plot and explore single-cell RNA-seq data with Scanpy
Time estimation: 2 hoursSupporting Materials:Published: Jul 19, 2023Last modification: Jun 25, 2026License: Tutorial Content is licensed under Creative Commons Attribution 4.0 International License. The GTN Framework is licensed under MITpurl PURL: https://gxy.io/GTN:T00357version Revision: 9
The magic of bioinformatic analysis is that we use maths, statistics and complicated algorithms to deal with huge amounts of data to help us investigate biology. However, analysis is not always straightforward – each tool has various parameters to select. Eventually, we can end up with very different outcomes depending on the values we choose. With analysing scRNA-seq data, it’s almost like you need to know about 75% of your data, then make sure your analysis shows that, for you to then be able to identify the 25% new information.
Given the vast array of values that we can specify in the tool parameters, how can we know if the values we choose are the most optimal ones - or at least good enough? Well, we can try different values in our workflow and then compare the outputs to see which is consistent with our understanding of the underlying biology. But can we do this efficiently, at scale, to test multiple values?
And here the Parameter Iterator comes in – it allows us to test different variables quickly and easily. This tutorial will show you how to use Parameter Iterator to generate multiple outputs with different parameter values in one go.
Tools are frequently updated to new versions. Your Galaxy may have multiple versions of the same tool available. By default, you will be shown the latest version of the tool. This may NOT be the same tool used in the tutorial you are accessing. Furthermore, if you use a newer tool in one step, and try using an older tool in the next step… this may fail! To ensure you use the same tool versions of a given tutorial, use the Tutorial mode feature.
- Open your Galaxy server
- Click on the curriculum icon on the top menu, this will open the GTN inside Galaxy.
- Navigate to your tutorial
- Tool names in tutorials will be blue buttons that open the correct tool for you
- Note: this does not work for all tutorials (yet)
- You can click anywhere in the grey-ed out area outside of the tutorial box to return back to the Galaxy analytical interface
Warning: Not all browsers work!
- We’ve had some issues with Tutorial mode on Safari for Mac users.
- Try a different browser if you aren’t seeing the button.
AgendaIn this tutorial, we will cover:
Get Data
The data used in this tutorial is from a mouse dataset of fetal growth restriction (Bacon et al. 2018). You can download the dataset below or import the history with the starting data.
Here are several ways of getting our toy dataset – choose whichever you like!
Hands On: Option 1: Data upload - Import history
Import history from: example input history
- Open the link to the shared history
- Click on the Import this history button on the top left
- Enter a title for the new history
- Click on Copy History
Rename galaxy-pencil the the history to your name of choice.
Hands On: Option 2: Data upload - Add to history
Create a new history for this tutorial
Import the files from Zenodo
https://zenodo.org/record/8011681/files/Scanpy_RunPCA_AnnData_object.h5ad
- Copy the link location
Click galaxy-upload Upload at the top of the activity panel
- Select galaxy-wf-edit Paste/Fetch Data
Paste the link(s) into the text field
Press Start
- Close the window
Rename the dataset if you wish:
Scanpy RunPCA: AnnData object
- Click on the galaxy-pencil pencil icon for the dataset to edit its attributes
- In the central panel, change the Name field
- Click the Save button
Check that the datatype is
h5ad
- Click on the galaxy-pencil pencil icon for the dataset to edit its attributes
- In the central panel, click galaxy-chart-select-data Datatypes tab on the top
- In the galaxy-chart-select-data Assign Datatype, select
datatypesfrom “New Type” dropdown
- Tip: you can start typing the datatype into the field to filter the dropdown menu
- Click the Save button

Workflow
This tutorial is an extension of the full analysis shown in Filter, Plot and Explore Single-cell RNA-seq Data tutorial in the Single-cell RNA-seq: Case Study series. So if you’ve been working through it, you can use your dataset from that tutorial here. If you haven’t completed it but you’re interested in how we get to this point, feel free to have a look at the mentioned tutorial.
Our starting data will be the output of Scanpy RunPCA tool. It is part of the full analysis tutorial, but we will only focus on a smaller and shortened bit of the full workflow to show the application of the Parameter Iterator. Our workflow consists of the following steps:
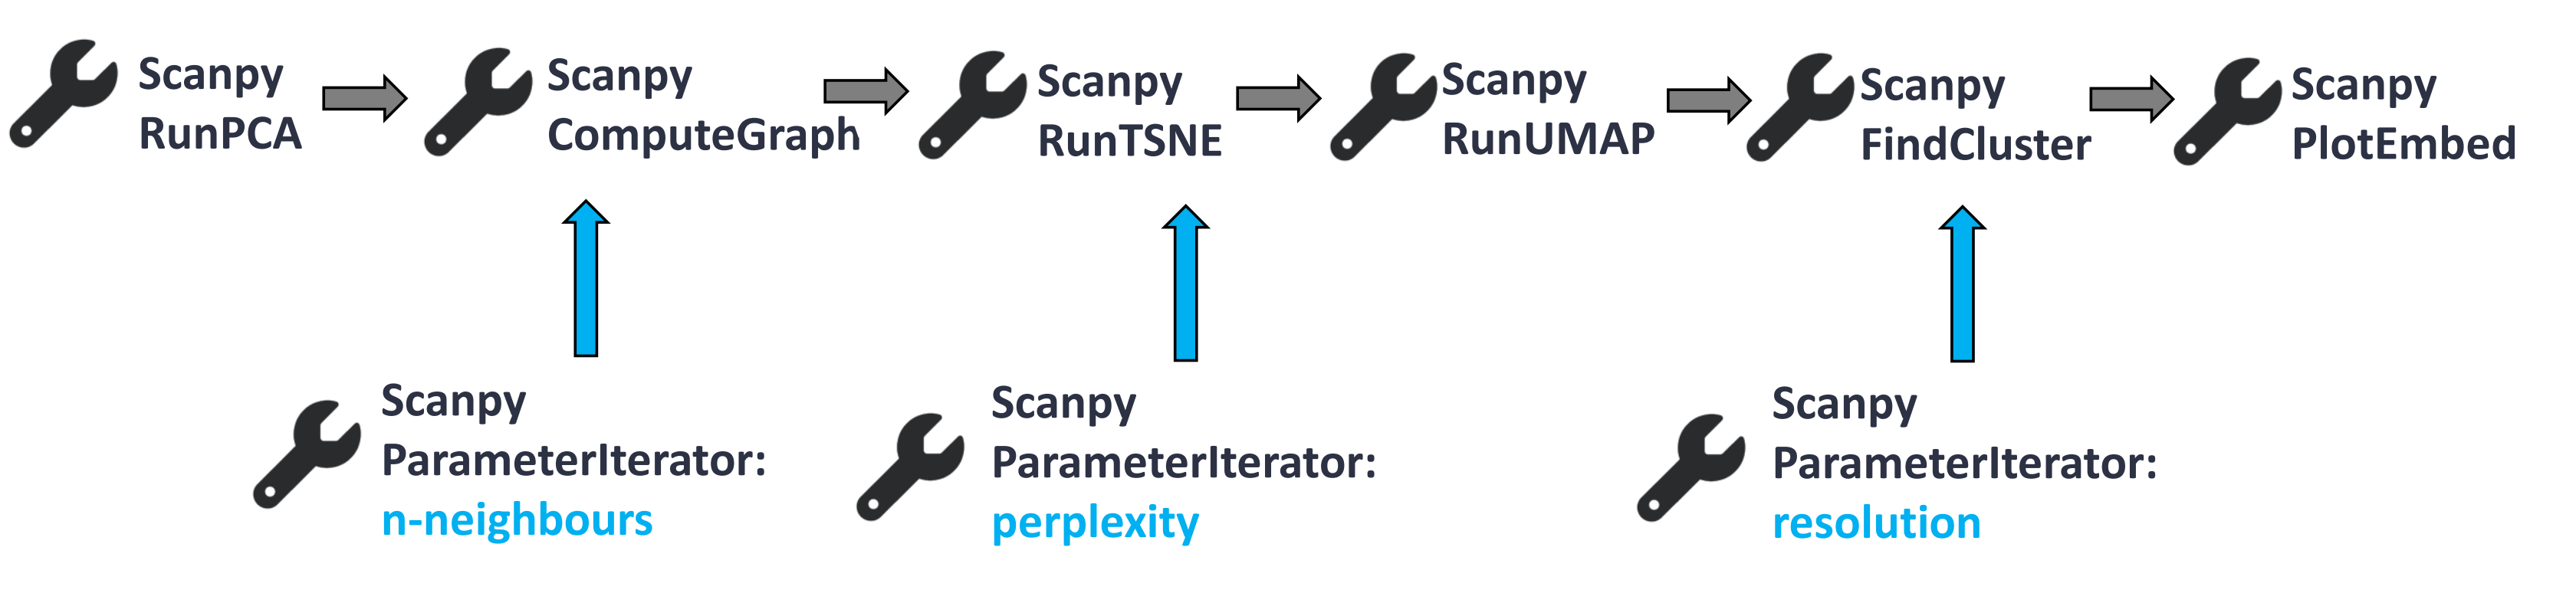 Open image in new tab
For the detailed explanation of the tools presented above, check out this tutorial.
Inputs
Scanpy ParameterIterator tool currently works only for the following parameters:
- Number of neighbours to derive kNN graph (for Scanpy ComputeGraph tool)
- Perplexity (for Scanpy RunTSNE tool)
- Resolution (for Scanpy FindCluster tool)
There are two formats of the input values:
- List of all parameter values to be iterated
- Step increase values to be iterated
Number of neighbours to derive kNN graph (for Scanpy ComputeGraph tool)
We will now use Scanpy ComputeGraph tool to derive the k-nearest neighbour (kNN) graph from our PCA values. We can use the Parameter Iterator to check how the different k values of nearest neighbours will affect the final outcome. It is important that k neighbours is an integer.
Warning: Float vs integerUsing ‘Step increase values to be iterated’ as the format of the input values automatically generates float values instead of integers. Float, or floating point numbers, are values with a ‘floating’ decimal point. To avoid float values, you must use ‘List of all parameter values to be iterated’ as your chosen values.
The kNN graph will be needed for plotting a UMAP. According to the UMAP developers: “Larger neighbor values will result in more global structure being preserved at the loss of detailed local structure. In general this parameter should often be in the range 5 to 50, with a choice of 10 to 15 being a sensible default”. Therefore, let’s pick some values bigger and smaller than 15 to check how it changes the final UMAP. This is where the Parameter Iterator comes in!
Hands On: Set your values in Parameter Iterator
- Scanpy ParameterIterator ( Galaxy version 0.0.1+galaxy9) with the following parameters:
- “Parameter type”:
n-neighbours- “Choose the format of the input values”:
List of all parameter values to be iterated- “User input values”:
5,10,15,20,25,30,35,40Rename galaxy-pencil the resulting list of datasets:
Parameter iterated - n-neighbours(you have to first click on the collection so that you see the datasets, and then rename it)- Tag galaxy-tags each dataset with its corresponding value:
- navigate to Show hidden (galaxy-show-hidden icon)
- add tags accordingly - n-neighbours_10:
#n-neighbours_10etc.- If you want to refresh your memory on how to add tags to datasets, have a look here:
Datasets can be tagged. This simplifies the tracking of datasets across the Galaxy interface. Tags can contain any combination of letters or numbers but cannot contain spaces.
To tag a dataset:
- Click on the dataset to expand it
- Click on Add Tags galaxy-tags
- Add tag text. Tags starting with
#will be automatically propagated to the outputs of tools using this dataset (see below).- Press Enter
- Check that the tag appears below the dataset name
Tags beginning with
#are special!They are called Name tags. The unique feature of these tags is that they propagate: if a dataset is labelled with a name tag, all derivatives (children) of this dataset will automatically inherit this tag (see below). The figure below explains why this is so useful. Consider the following analysis (numbers in parenthesis correspond to dataset numbers in the figure below):
- a set of forward and reverse reads (datasets 1 and 2) is mapped against a reference using Bowtie2 generating dataset 3;
- dataset 3 is used to calculate read coverage using BedTools Genome Coverage separately for
+and-strands. This generates two datasets (4 and 5 for plus and minus, respectively);- datasets 4 and 5 are used as inputs to Macs2 broadCall datasets generating datasets 6 and 8;
- datasets 6 and 8 are intersected with coordinates of genes (dataset 9) using BedTools Intersect generating datasets 10 and 11.
Now consider that this analysis is done without name tags. This is shown on the left side of the figure. It is hard to trace which datasets contain “plus” data versus “minus” data. For example, does dataset 10 contain “plus” data or “minus” data? Probably “minus” but are you sure? In the case of a small history like the one shown here, it is possible to trace this manually but as the size of a history grows it will become very challenging.
The right side of the figure shows exactly the same analysis, but using name tags. When the analysis was conducted datasets 4 and 5 were tagged with
#plusand#minus, respectively. When they were used as inputs to Macs2 resulting datasets 6 and 8 automatically inherited them and so on… As a result it is straightforward to trace both branches (plus and minus) of this analysis.More information is in a dedicated #nametag tutorial.

The output of the Parameter Iterator is the list of datasets. We will be working on dataset collections quite a lot, so if you want to gain more understanding of collection operations, visit the corresponding tutorial.
Hands On: Derive kNN graph with iterated parameter
- Scanpy ComputeGraph ( Galaxy version 1.8.1+galaxy9) with the following parameters:
- param-file “Input object in AnnData/Loom format”:
Scanpy RunPCA: AnnData object- “Use programme defaults”: param-toggle
No- “File with n_neighbours, use with parameter iterator. Overrides the n_neighbors setting”:
- Click on param-collection (Dataset collection)
- Choose
Parameter iterated - n-neighbours- “Use the indicated representation”:
X_pca- “Number of PCs to use”:
20- Rename galaxy-pencil the resulting list of datasets:
Scanpy ComputeGraph on collection X: Graph object AnnData (n-neighbours)(you have to first click on the collection so that you see the datasets, and then rename it)
You should now see the output is also a collection. If you click on that, you will see Anndata files, differing only by the n-neighbour value.
Now you have two options, either:
- pick one of the generated output files and proceed to the next tool with another parameter iteration; or
- continue with the current collection of datasets.
We choose the second option as only then you will be able to see the effect of using different nearest neighbour values. However, the disadvantage of this option is that you have to select only one value for the subsequent parameters in the workflow in order to see the changes in the final plots.
Comment: Why only one Parameter Iteration at a time?Iterating the parameters within one tool will give you a list with X datasets: each dataset is the output with the given parameter value. However, if you want to use Parameter Iterator again within another tool, specifying Y parameter values, you will not get X x Y datasets as you might expect. Therefore you have to choose just one output file to be passed on to the next tool which will use Parameter Iterator again. Alternatively, you can use Parameter Iterator once and run the rest of the tools on dataset collection with just one parameter value.
Where are we now in our workflow?
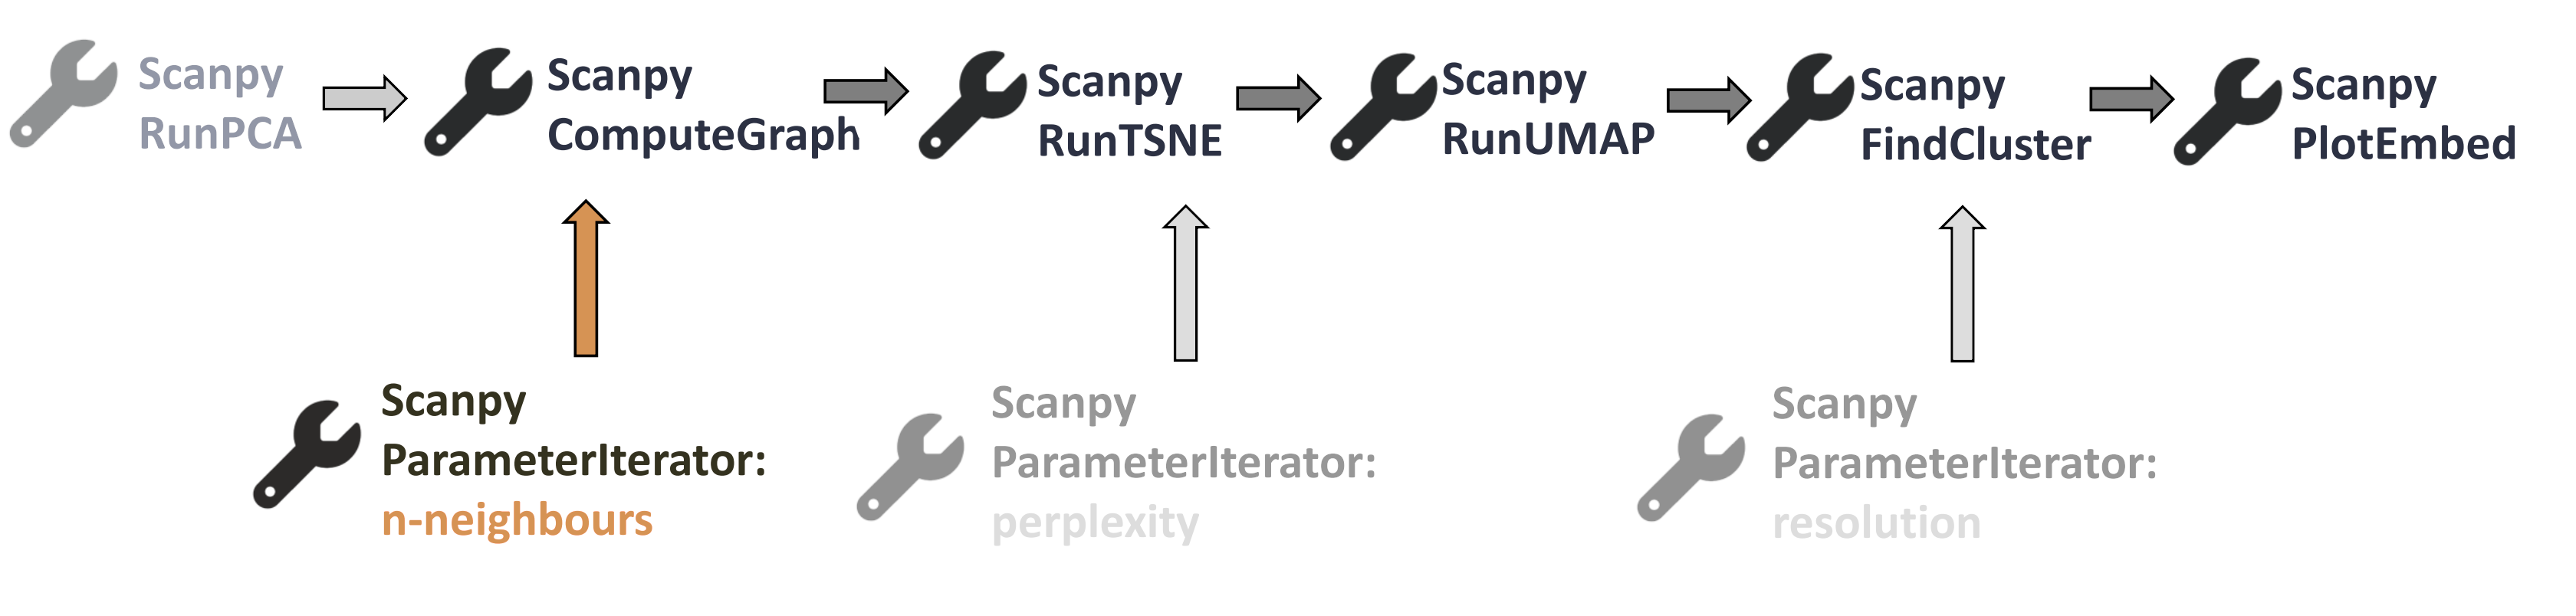 Open image in new tab
Hands On: Complete the workflow
- Scanpy RunTSNE ( Galaxy version 1.8.1+galaxy9) with the following parameters:
- param-collection “Input object in AnnData/Loom format” (make sure you choose Dataset collection):
Scanpy ComputeGraph on collection X: Graph object AnnData (n-neighbours)- “Use the indicated representation”:
X_pca- “Use programme defaults”: param-toggle
No- “The perplexity is related to the number of nearest neighbours, select a value between 5 and 50”:
301A. Rename galaxy-pencil the Anndata object collection output:
Scanpy RunTSNE on collection X: tSNE object AnnData (n-neighbours)(you have to first click on the collection so that you see the datasets, and then rename it)
- Scanpy RunUMAP ( Galaxy version 1.8.1+galaxy9) with the following parameters:
- param-collection “Input object in AnnData/Loom format” (make sure you choose Dataset collection):
Scanpy RunTSNE on collection X: tSNE object AnnData (n-neighbours)- “Use programme defaults”: param-toggle
Yes2A. Rename galaxy-pencil the Anndata object collection output:
Scanpy RunUMAP on collection X: UMAP object AnnData (n-neighbours)(you have to first click on the collection so that you see the datasets, and then rename it)
- Scanpy FindCluster ( Galaxy version 1.8.1+galaxy9) with the following parameters:
- param-collection “Input object in AnnData/Loom format” (make sure you choose Dataset collection):
Scanpy RunUMAP on collection X: UMAP object AnnData- “Use programme defaults”: param-toggle
No- “Resolution, high value for more and smaller clusters”:
0.63A. Rename galaxy-pencil the Anndata object collection output:
Scanpy FindCluster on collection X: Clusters AnnData (n-neighbours)(you have to first click on the collection so that you see the datasets, and then rename it)
The differences will only appear in the UMAP embedding, so we’ll plot only them. However, when you run your own analysis, you might want to check if there are changes in other embeddings as well.
Hands On: Plot UMAP embedding
- Scanpy PlotEmbed ( Galaxy version 1.8.1+galaxy9) with the following parameters:
- param-collection “Input object in AnnData/Loom format” (make sure you choose Dataset collection):
Scanpy FindCluster on collection X: Clusters AnnData (n-neighbours)- “name of the embedding to plot”:
umap- “color by attributes, comma separated texts”:
louvain- “Use raw attributes if present”:
No
If you click on the resulting collection you will see several plots. Click on galaxy-eye to see how they differ. Galaxy’s galaxy-scratchbook Window Manager, which you can enable (and disable again) from the menu bar can be very helpful for comparing multiple datasets.
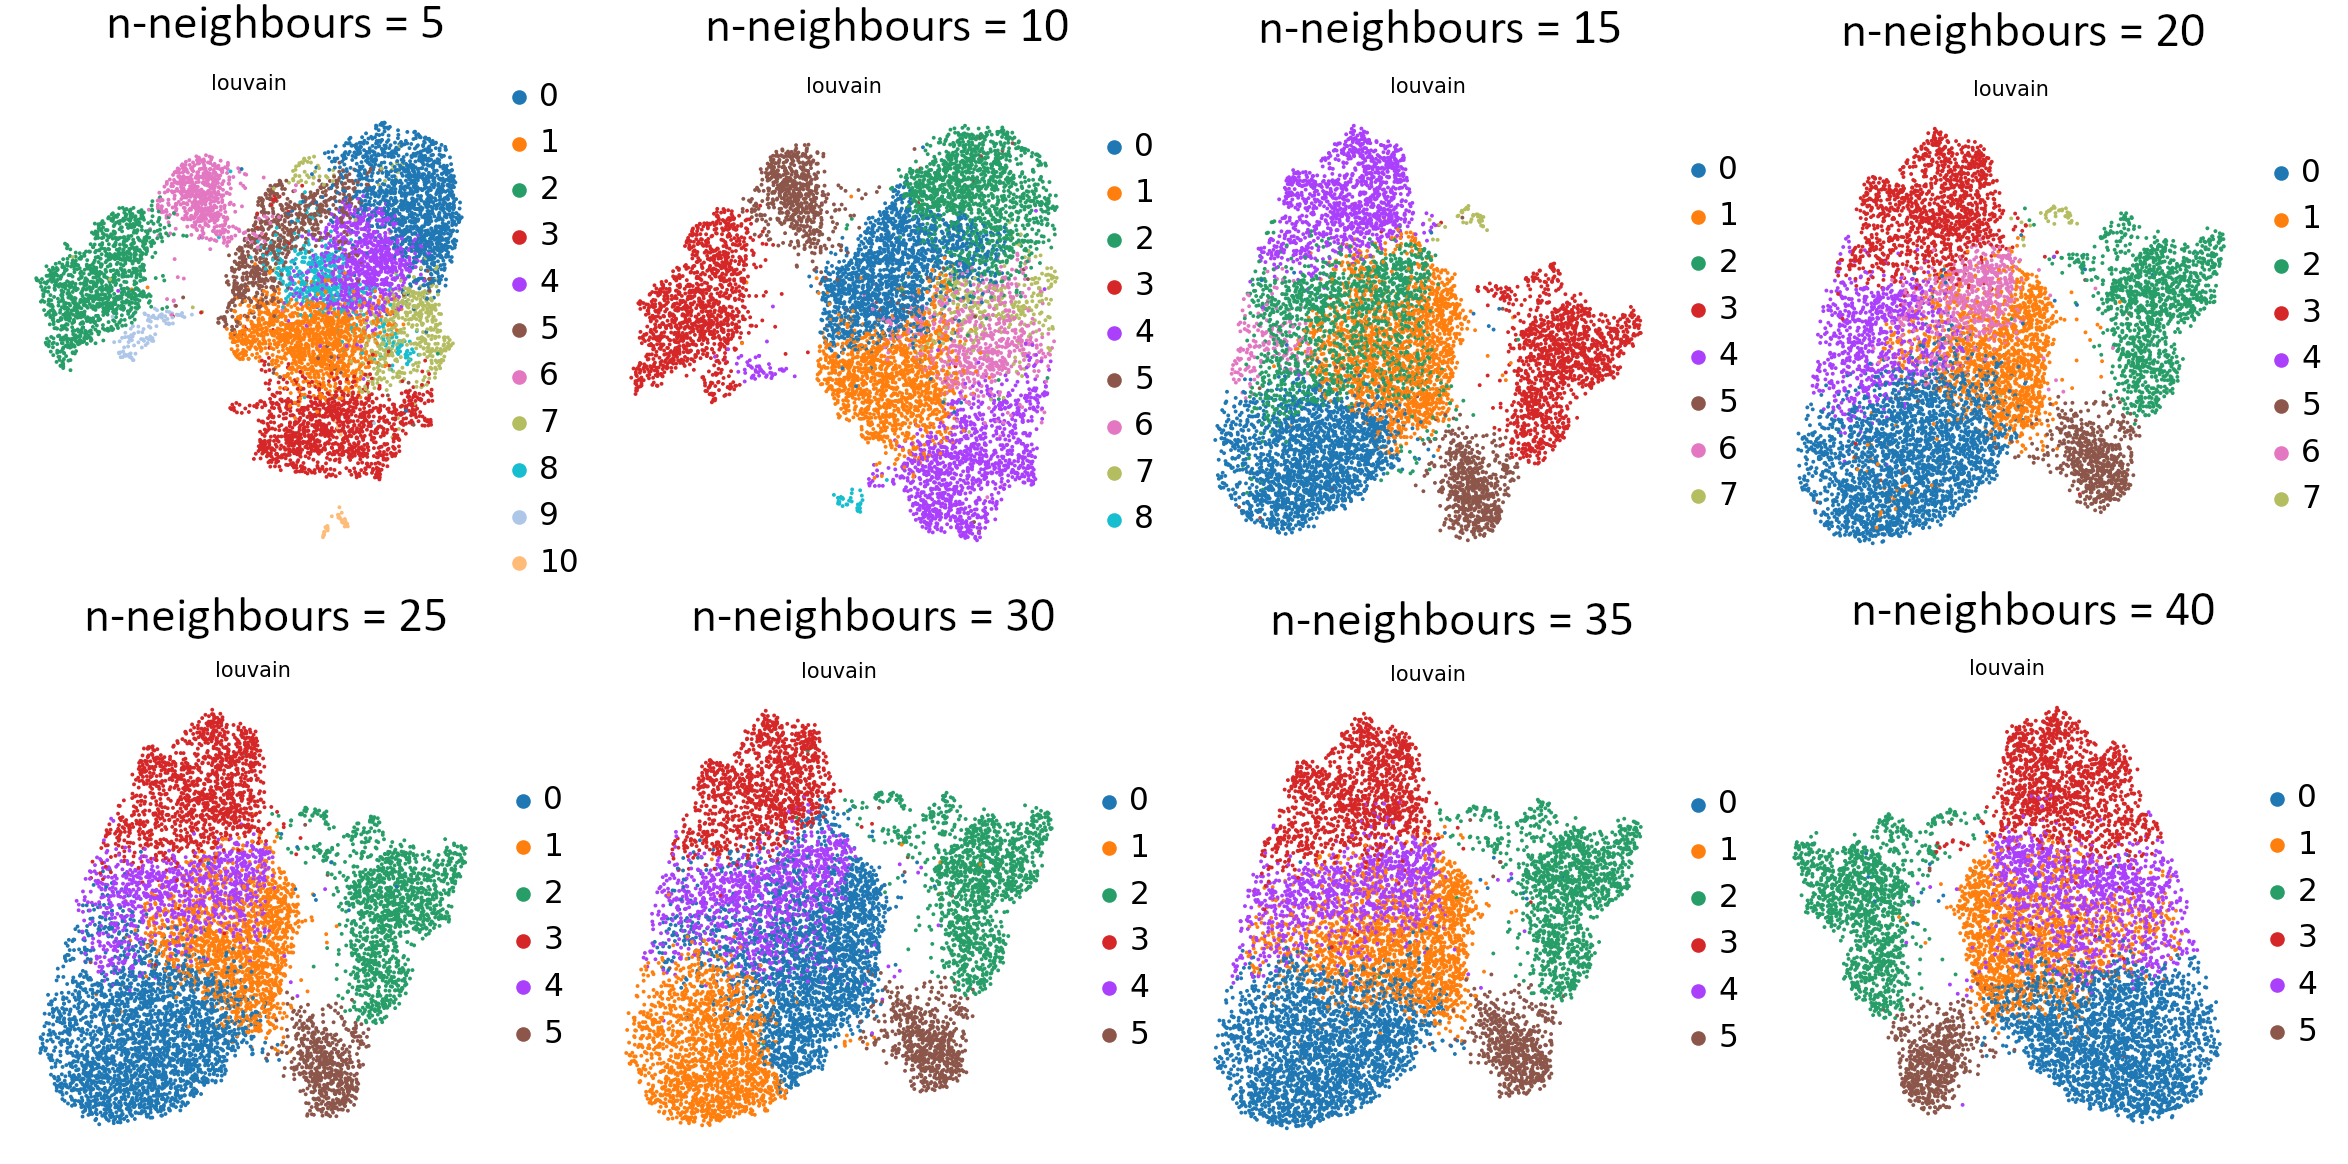 Open image in new tab
If you compare the UMAP graphs, you can see the differences that were caused by changing the value of k nearestneighbours. Relying on your biological knowledge, you can now choose which parameter value works best and use it for further analysis.
We will go forward with k value equal to 15. But hang on, we’ve been working on a collection and not a single dataset! How can we access that one dataset with the n-neighbour = 15?
Here is the answer: The datasets that are included in the collections can be accessed separately if you go to your history and click on Show hidden (galaxy-show-hidden icon). You can bring each individual dataset to the visible and active datasets by clicking Unhide.
Hands On: Unhide the dataset of interest
- In Show hidden find the dataset
Scanpy ComputeGraph on data X and data Y: Graph object AnnDatawith the tag#n-neighbours_15(or any value that you want to go forward with).- Click on Unhide
- Your chosen dataset is now visible amongst the active datasets in your history!
Perplexity (for Scanpy RunTSNE tool)
Let’s have another look at our wee workflow.
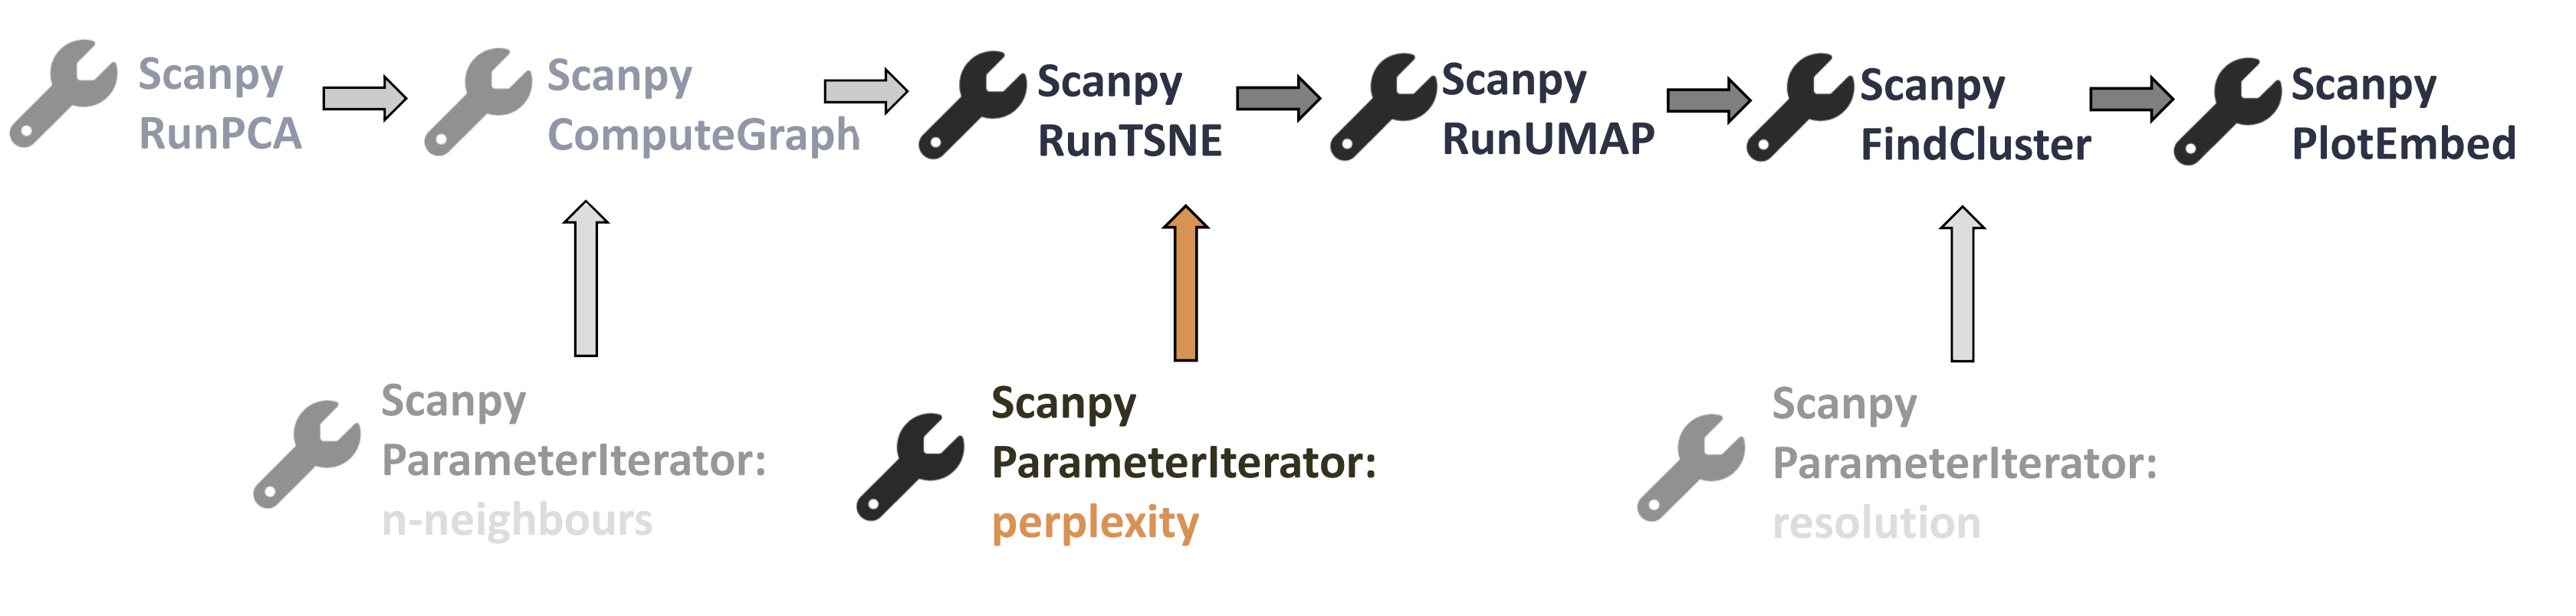 Open image in new tab
The next tool in our workflow is Scanpy RunTSNE, which contains the perplexity parameter. Although the tool description says that this value should be an integer, we tested it with float values and it works. Therefore, you can use ‘Step increase values to be iterated’. Keep in mind that perplexity should take values between 5 and 50. Let’s run the Parameter Iterator again.
Hands On: Set your values in Parameter Iterator
- Scanpy ParameterIterator ( Galaxy version 0.0.1+galaxy9) with the following parameters:
- “Parameter type”:
perplexity- “Choose the format of the input values”:
Step increase values to be iterated- “Starting value”:
15- “Step”:
5- “Ending value”:
45Rename galaxy-pencil the resulting list of datasets:
Parameter iterated - perplexity(you have to first click on the collection so that you see the datasets, and then rename it)- Tag galaxy-tags each dataset with its corresponding value:
- navigate to Show hidden (galaxy-show-hidden icon)
- add tags accordingly - perplexity_15:
#perplexity_15etc.- If you want to refresh your memory on how to add tags to datasets, have a look here:
Datasets can be tagged. This simplifies the tracking of datasets across the Galaxy interface. Tags can contain any combination of letters or numbers but cannot contain spaces.
To tag a dataset:
- Click on the dataset to expand it
- Click on Add Tags galaxy-tags
- Add tag text. Tags starting with
#will be automatically propagated to the outputs of tools using this dataset (see below).- Press Enter
- Check that the tag appears below the dataset name
Tags beginning with
#are special!They are called Name tags. The unique feature of these tags is that they propagate: if a dataset is labelled with a name tag, all derivatives (children) of this dataset will automatically inherit this tag (see below). The figure below explains why this is so useful. Consider the following analysis (numbers in parenthesis correspond to dataset numbers in the figure below):
- a set of forward and reverse reads (datasets 1 and 2) is mapped against a reference using Bowtie2 generating dataset 3;
- dataset 3 is used to calculate read coverage using BedTools Genome Coverage separately for
+and-strands. This generates two datasets (4 and 5 for plus and minus, respectively);- datasets 4 and 5 are used as inputs to Macs2 broadCall datasets generating datasets 6 and 8;
- datasets 6 and 8 are intersected with coordinates of genes (dataset 9) using BedTools Intersect generating datasets 10 and 11.
Now consider that this analysis is done without name tags. This is shown on the left side of the figure. It is hard to trace which datasets contain “plus” data versus “minus” data. For example, does dataset 10 contain “plus” data or “minus” data? Probably “minus” but are you sure? In the case of a small history like the one shown here, it is possible to trace this manually but as the size of a history grows it will become very challenging.
The right side of the figure shows exactly the same analysis, but using name tags. When the analysis was conducted datasets 4 and 5 were tagged with
#plusand#minus, respectively. When they were used as inputs to Macs2 resulting datasets 6 and 8 automatically inherited them and so on… As a result it is straightforward to trace both branches (plus and minus) of this analysis.More information is in a dedicated #nametag tutorial.
Hands On: RunTSNE with iterated parameter
- Scanpy RunTSNE ( Galaxy version 1.8.1+galaxy9) with the following parameters:
- param-file “Input object in AnnData/Loom format”:
Scanpy ComputeGraph on data X and data Y: Graph object AnnDatawith the tag#n-neighbours_15- “Use the indicated representation”:
X_pca- “Use programme defaults”: param-toggle
No- “The perplexity is related to the number of nearest neighbours”:
- Click on param-collection (Dataset collection)
- Choose
Parameter iterated - perplexity- Rename galaxy-pencil the Anndata object collection output:
Scanpy RunTSNE on collection X: tSNE object AnnData (perplexity)(you have to first click on the collection so that you see the datasets, and then rename it)
Changing the value of perplexity will only affect the tSNE graphs, so we can complete the workflow and compare the tSNE plots to choose the best value for further analysis.
Hands On: Complete the workflow
- Scanpy RunUMAP ( Galaxy version 1.8.1+galaxy9) with the following parameters:
- param-collection “Input object in AnnData/Loom format” (make sure you choose Dataset collection):
Scanpy RunTSNE on collection X: tSNE object AnnData (perplexity)- “Use programme defaults”: param-toggle
Yes1A. Rename galaxy-pencil the Anndata object collection output:
Scanpy RunUMAP on collection X: UMAP object AnnData (perplexity)(you have to first click on the collection so that you see the datasets, and then rename it)
- Scanpy FindCluster ( Galaxy version 1.8.1+galaxy9) with the following parameters:
- param-collection “Input object in AnnData/Loom format” (make sure you choose Dataset collection):
Scanpy RunUMAP on collection X: UMAP object AnnData (perplexity)- “Use programme defaults”: param-toggle
No- “Resolution, high value for more and smaller clusters”:
0.63A. Rename galaxy-pencil the Anndata object collection output:
Scanpy FindCluster on collection X: Clusters AnnData (perplexity)(you have to first click on the collection so that you see the datasets, and then rename it)
WarningIn Use programme defaults you can specify Additional suffix to the name of the slot to save the embedding – if it’s included, PERPLEXITY will be substituted with the value of the perplexity setting. However, in that case you will get an error when using Scanpy PlotEmbed: due to the value included in the entry name, the tool will not recognise the correct embedding. Therefore, we leave that box unfilled even though it would make it easier to differentiate between datasets.
Hands On: Plot tSNE embedding
- Scanpy PlotEmbed ( Galaxy version 1.8.1+galaxy9) with the following parameters:
- param-collection “Input object in AnnData/Loom format” (make sure you choose Dataset collection):
Scanpy FindCluster on collection X: Clusters AnnData (perplexity)- “name of the embedding to plot”:
tsne- “color by attributes, comma separated texts”:
louvain- “Use raw attributes if present”:
No
Can you see those differences?
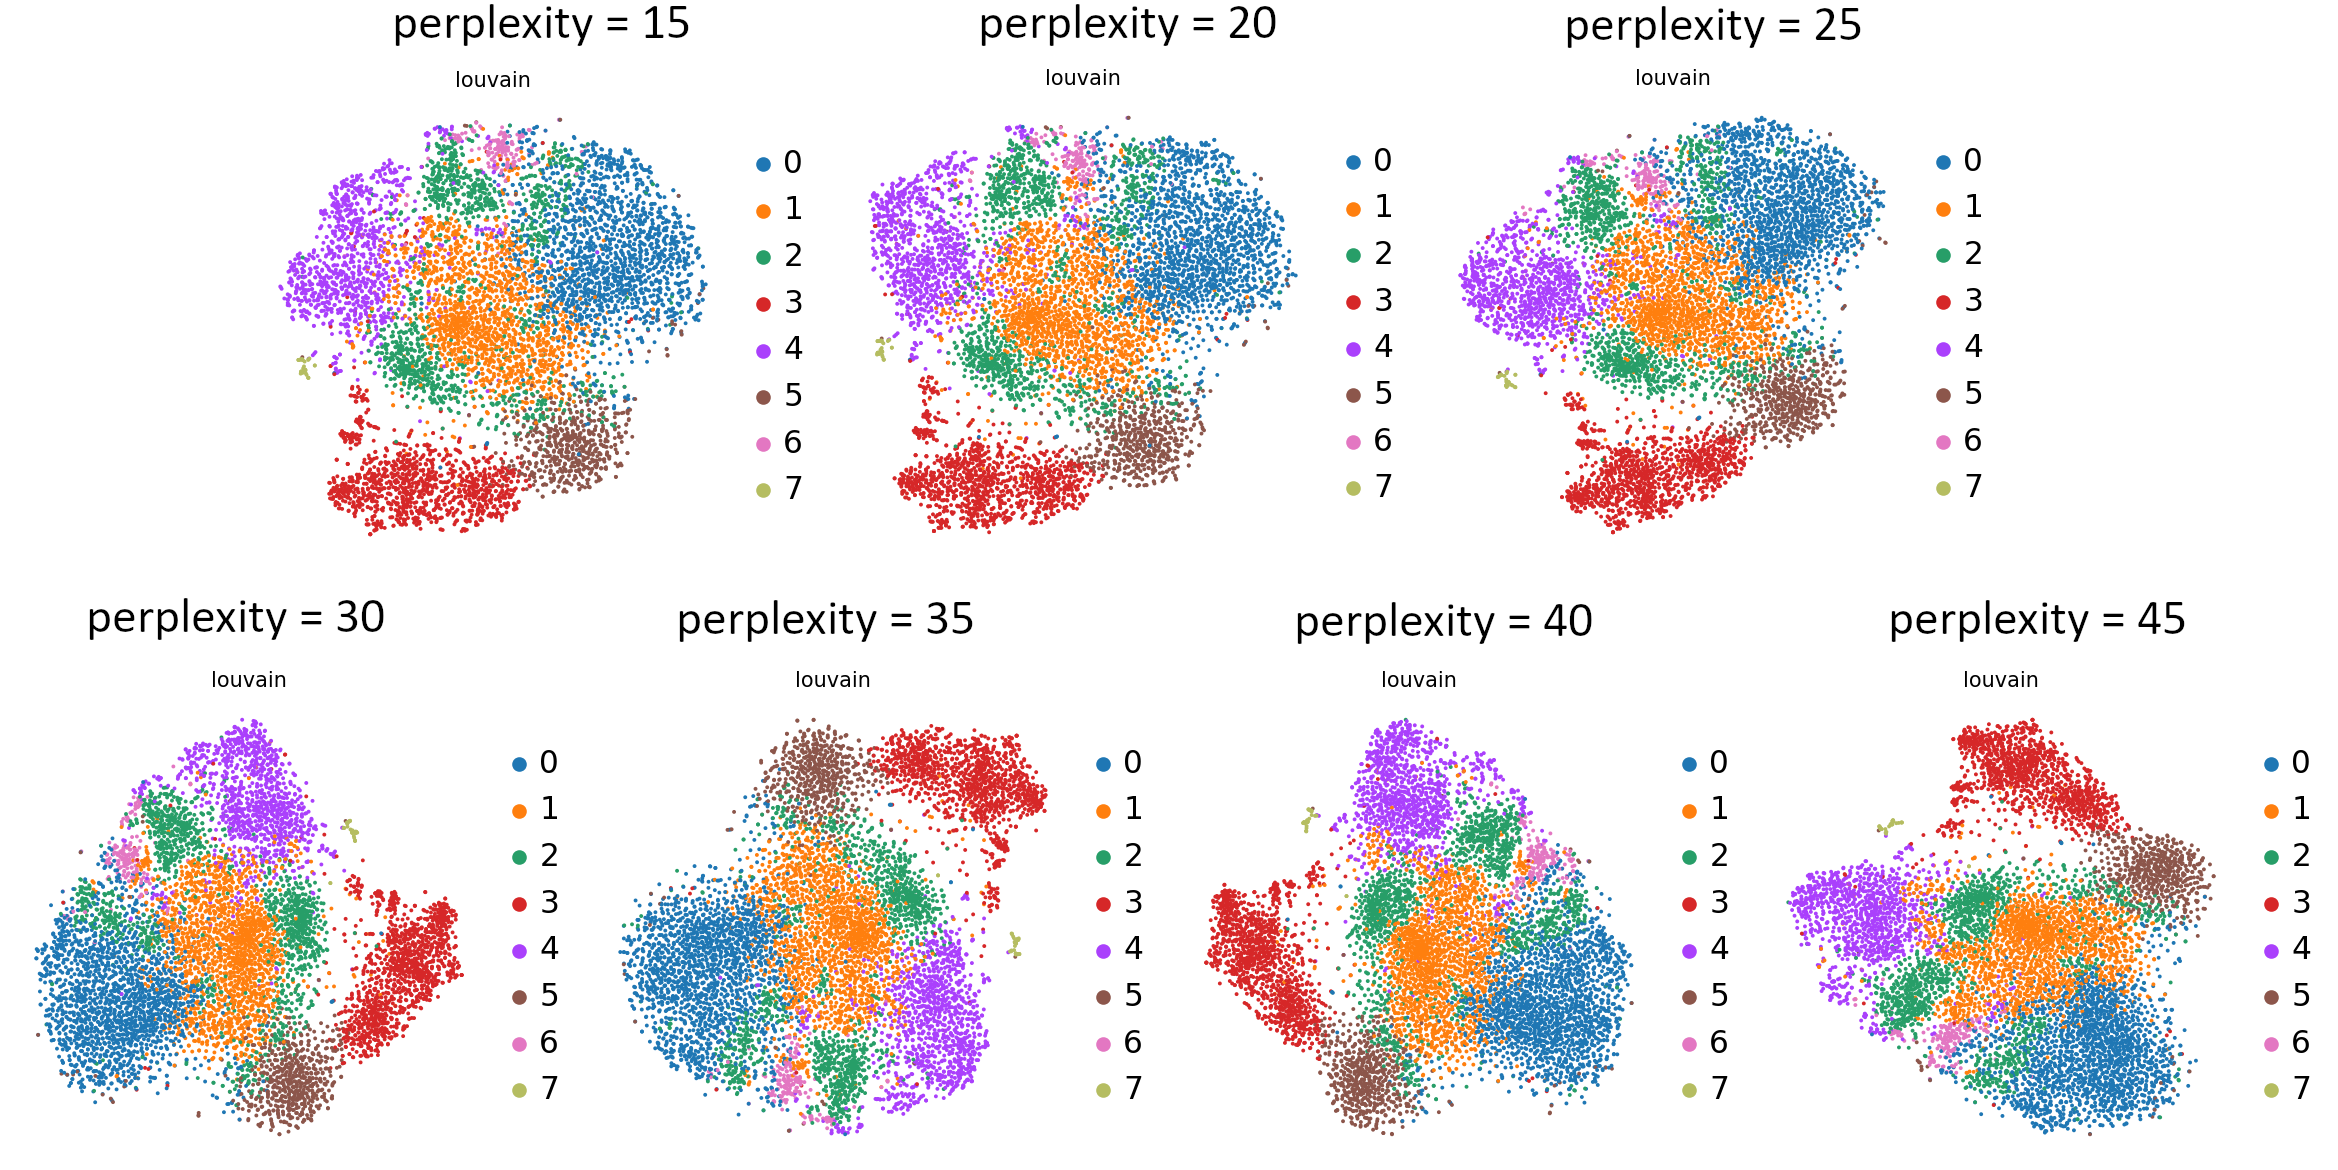 Open image in new tab
What do you think about those plots? Which value would you choose? Perplexity is probably the least intuitive or consistently functioning parameter, so feel free to learn more from this nifty blog post. We will go forward with a perplexity value equal to 30.
Resolution (for Scanpy FindCluster tool)
Where is Scanpy FindCluster tool in our workflow?
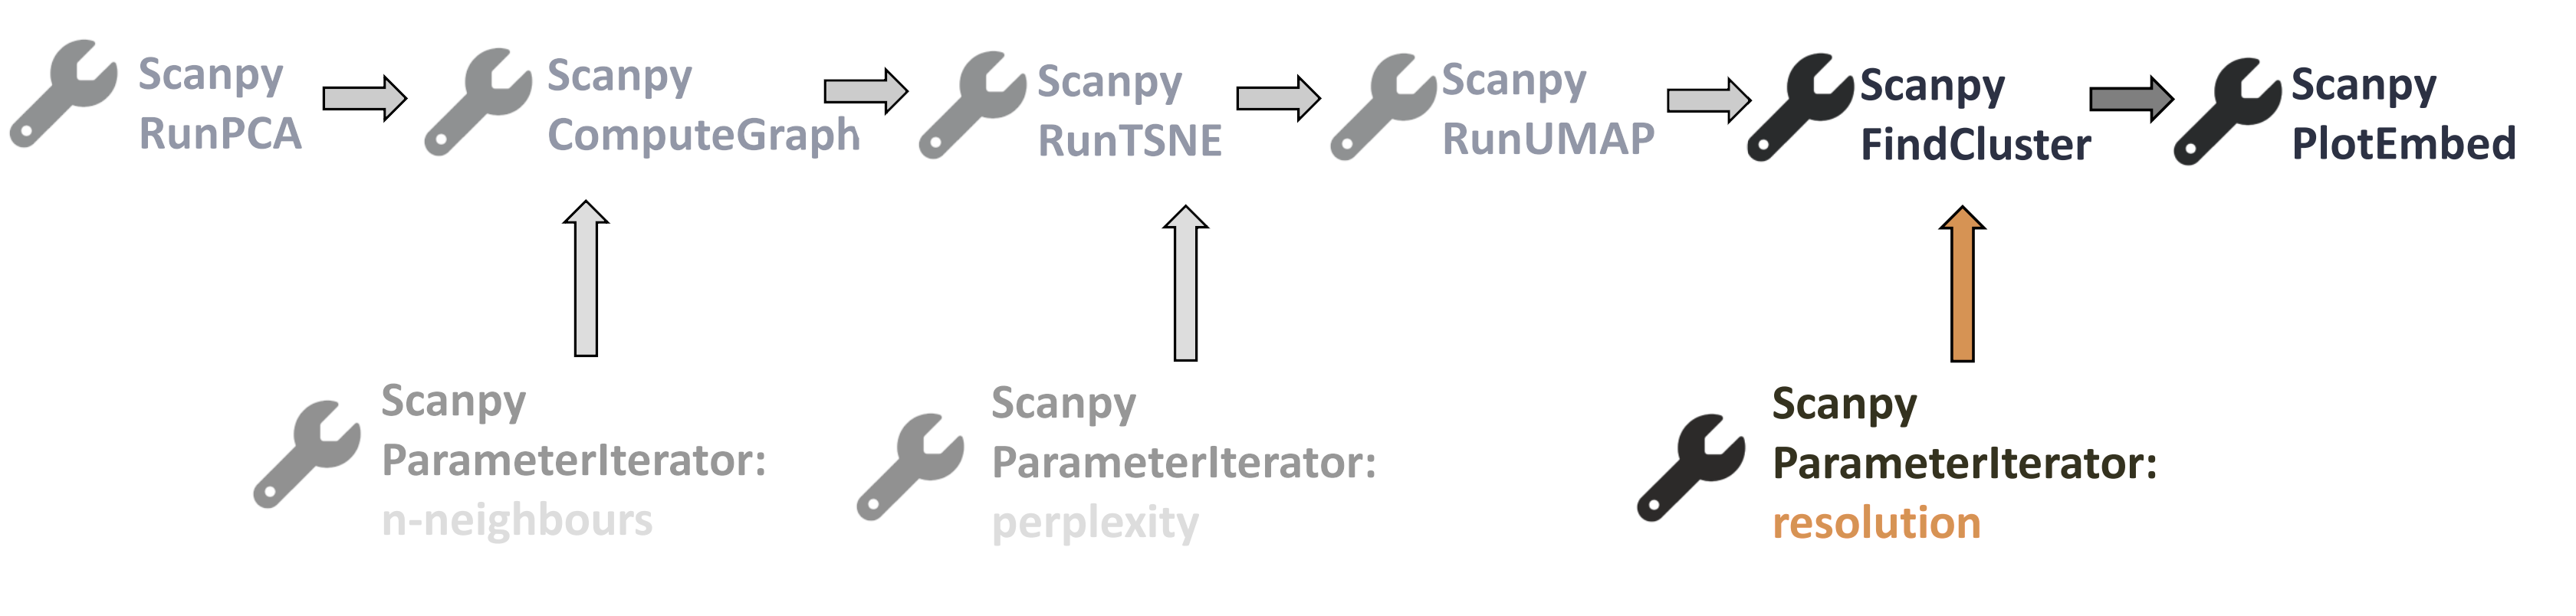 Open image in new tab
The input data for the Scanpy FindCluster tool is the output of Scanpy RunUMAP tool, so let’s get this single dataset with the parameter values (from previous tools) of our choice, that is n-neighbours=15 and perplexity=30.
Hands On: Unhide the dataset of interest
- In Show hidden find the dataset
Scanpy RunUMAP on data X: UMAP object AnnDatawith the tags#n-neighbours_15and#perplexity_30(or any value that you want to go forward with).- Click on Unhide
- Your chosen dataset is now visible amongst the active datasets in your history!
The last tool that we can use Parameter Iterator for is Scanpy FindCluster tool. We will iterate over the resolution values. In this case, those values can be floats, so you can use either ‘List of all parameter values to be iterated’ or ‘Step increase values to be iterated’. Keep in mind that when it comes to the resolution, a high value means more and smaller clusters.
Hands On: Set your values in Parameter Iterator
- Scanpy ParameterIterator ( Galaxy version 0.0.1+galaxy9) with the following parameters:
- “Parameter type”:
resolution- “Choose the format of the input values”:
Step increase values to be iterated- “Starting value”:
0.2- “Step”:
0.2- “Ending value”:
1.4Rename galaxy-pencil the resulting list of datasets:
Parameter iterated - resolution(you have to first click on the collection so that you see the datasets, and then rename it)- Tag galaxy-tags each dataset with its corresponding value:
- navigate to Show hidden (galaxy-show-hidden icon)
- add tags accordingly - resolution_0.2:
#resolution_0.2etc.- If you want to refresh your memory on how to add tags to datasets, have a look here:
Datasets can be tagged. This simplifies the tracking of datasets across the Galaxy interface. Tags can contain any combination of letters or numbers but cannot contain spaces.
To tag a dataset:
- Click on the dataset to expand it
- Click on Add Tags galaxy-tags
- Add tag text. Tags starting with
#will be automatically propagated to the outputs of tools using this dataset (see below).- Press Enter
- Check that the tag appears below the dataset name
Tags beginning with
#are special!They are called Name tags. The unique feature of these tags is that they propagate: if a dataset is labelled with a name tag, all derivatives (children) of this dataset will automatically inherit this tag (see below). The figure below explains why this is so useful. Consider the following analysis (numbers in parenthesis correspond to dataset numbers in the figure below):
- a set of forward and reverse reads (datasets 1 and 2) is mapped against a reference using Bowtie2 generating dataset 3;
- dataset 3 is used to calculate read coverage using BedTools Genome Coverage separately for
+and-strands. This generates two datasets (4 and 5 for plus and minus, respectively);- datasets 4 and 5 are used as inputs to Macs2 broadCall datasets generating datasets 6 and 8;
- datasets 6 and 8 are intersected with coordinates of genes (dataset 9) using BedTools Intersect generating datasets 10 and 11.
Now consider that this analysis is done without name tags. This is shown on the left side of the figure. It is hard to trace which datasets contain “plus” data versus “minus” data. For example, does dataset 10 contain “plus” data or “minus” data? Probably “minus” but are you sure? In the case of a small history like the one shown here, it is possible to trace this manually but as the size of a history grows it will become very challenging.
The right side of the figure shows exactly the same analysis, but using name tags. When the analysis was conducted datasets 4 and 5 were tagged with
#plusand#minus, respectively. When they were used as inputs to Macs2 resulting datasets 6 and 8 automatically inherited them and so on… As a result it is straightforward to trace both branches (plus and minus) of this analysis.More information is in a dedicated #nametag tutorial.
Hands On: FindCluster with iterated parameter
- Scanpy FindCluster ( Galaxy version 1.8.1+galaxy9) with the following parameters:
- param-file “Input object in AnnData/Loom format”:
Scanpy RunUMAP on data X: UMAP object AnnDatawith the tags#n-neighbours_15and#perplexity_30
- “Use programme defaults”: param-toggle
No- “File with resolution, use with parameter iterator. Overrides the resolution setting”:
- Click on param-collection (Dataset collection)
- Choose
Parameter iterated - resolution- Rename galaxy-pencil the Anndata object collection output:
Scanpy FindCluster on collection X: Clusters AnnData (resolution)(you have to first click on the collection so that you see the datasets, and then rename it)
You can see the effect of resolution parameter on all embeddings: UMAP, tSNE and PCA so you can plot them all and compare the granularity of the clusters. It is also useful to see how the equal increments affect the clustering and what is the rate of change of the granularity.
Hands On: Plot the embeddings
- Scanpy PlotEmbed ( Galaxy version 1.8.1+galaxy9) with the following parameters:
- param-collection “Input object in AnnData/Loom format” (make sure you choose Dataset collection):
Scanpy FindCluster on collection X: Clusters AnnData (resolution)- “name of the embedding to plot”:
pca- “color by attributes, comma separated texts”:
louvain- “Use raw attributes if present”:
NoYou can re-run galaxy-refresh the same tool again, but changepcatotsneand then finally toumapin order to skip the following two steps.- Scanpy PlotEmbed ( Galaxy version 1.8.1+galaxy9) with the following parameters:
- param-collection “Input object in AnnData/Loom format” (make sure you choose Dataset collection):
Scanpy FindCluster on collection X: Clusters AnnData (resolution)- “name of the embedding to plot”:
tsne- “color by attributes, comma separated texts”:
louvain- “Use raw attributes if present”:
No- Scanpy PlotEmbed ( Galaxy version 1.8.1+galaxy9) with the following parameters:
- param-collection “Input object in AnnData/Loom format” (make sure you choose Dataset collection):
Scanpy FindCluster on collection X: Clusters AnnData (resolution)- “name of the embedding to plot”:
umap- “color by attributes, comma separated texts”:
louvain- “Use raw attributes if present”:
No
That’s the last tool in our workflow which uses Parameter Iterator! Let’s have a final look at the generated plots.
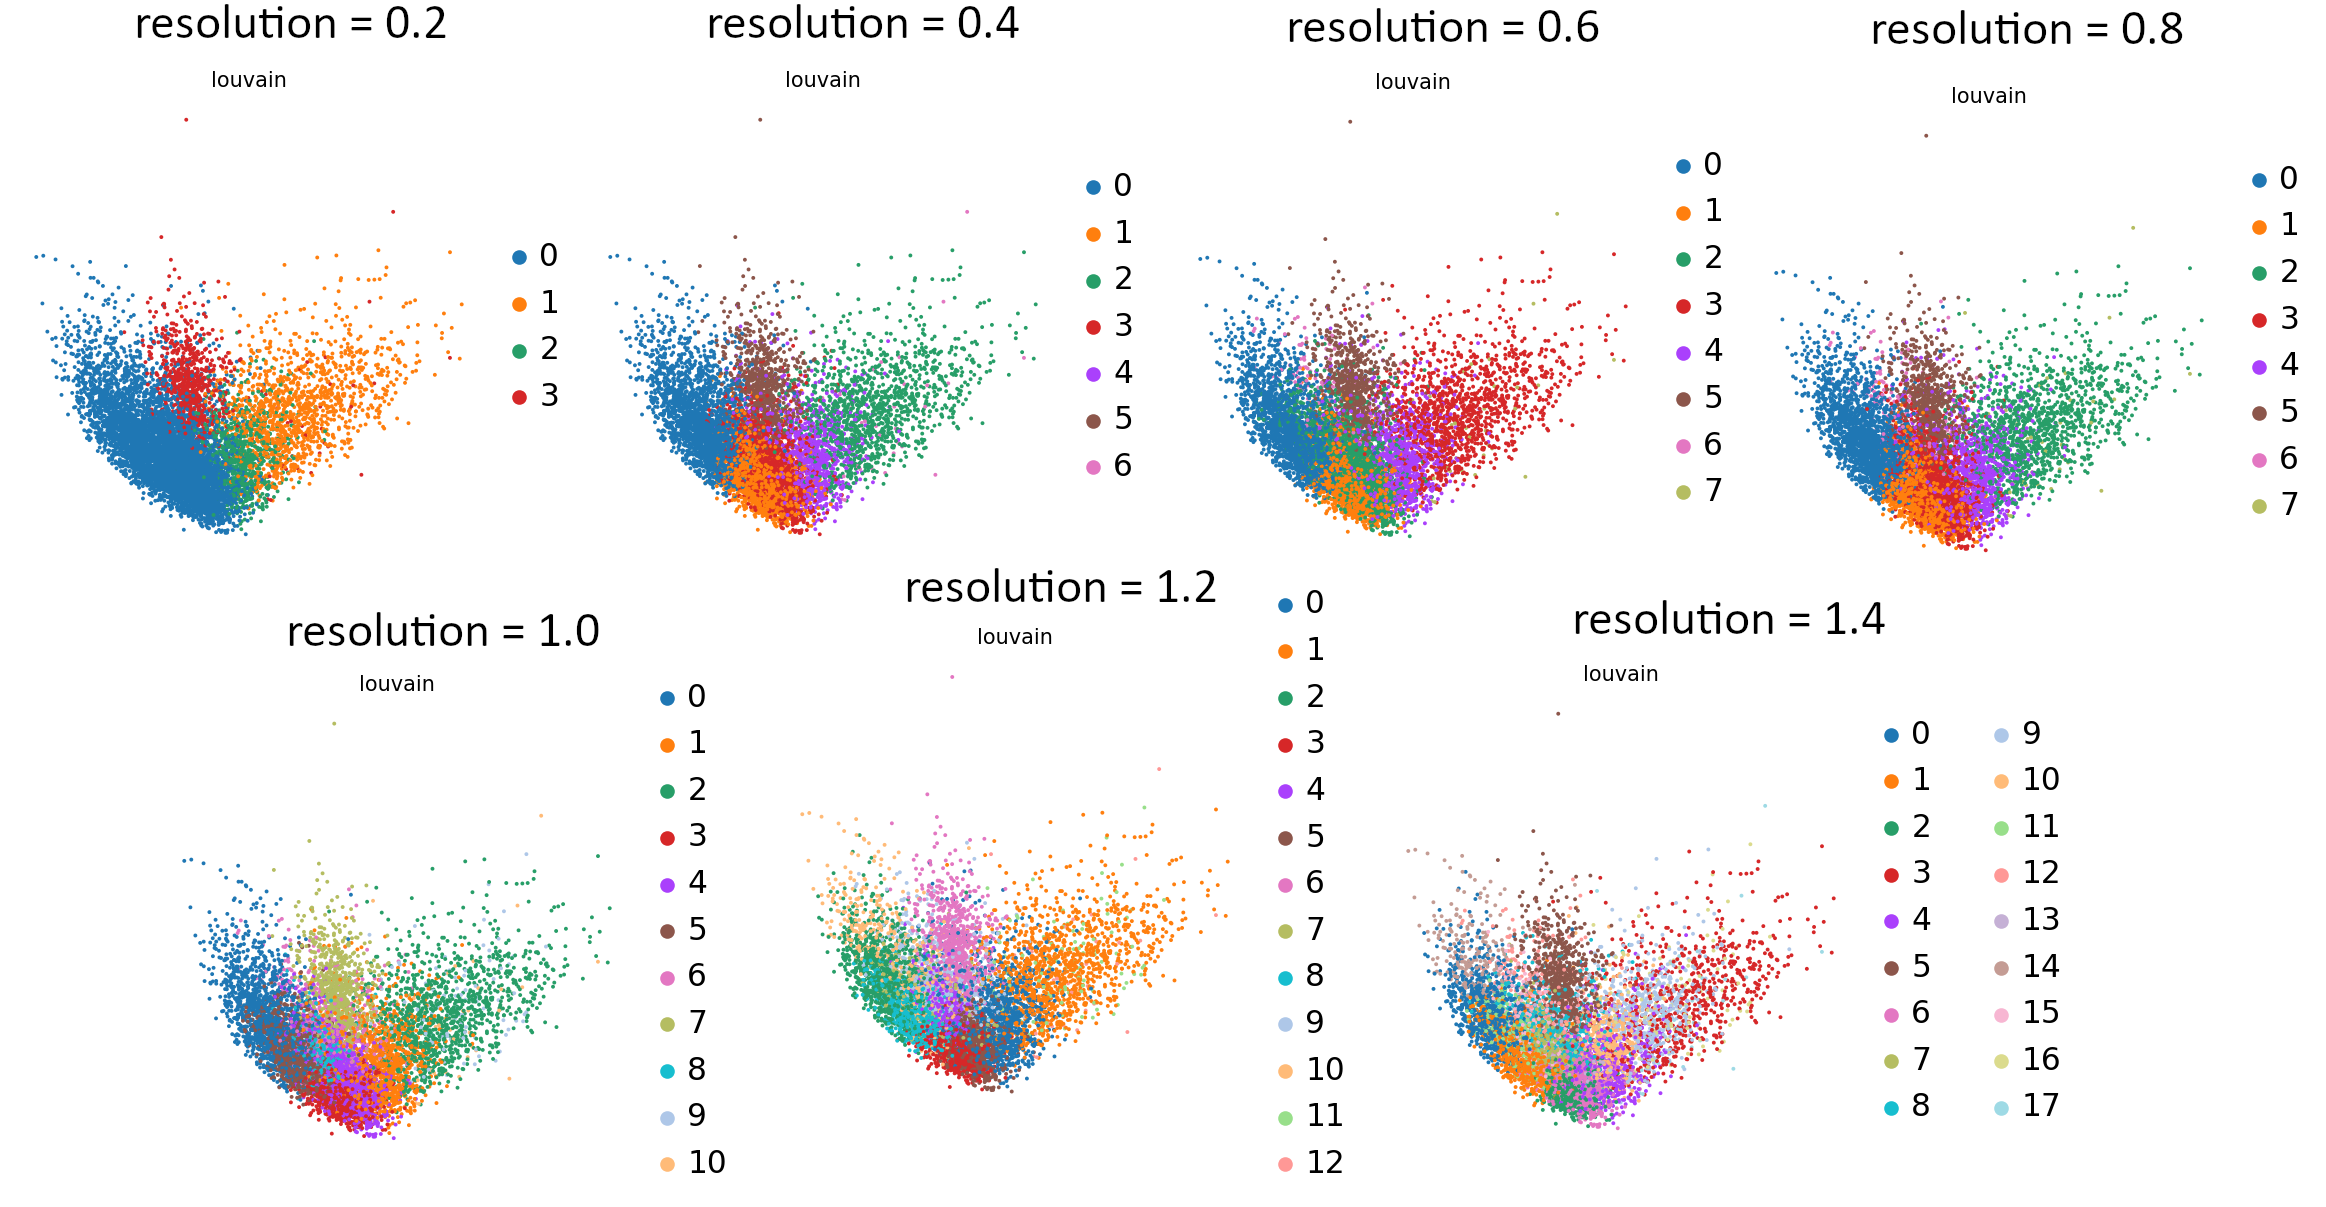 Open image in new tab
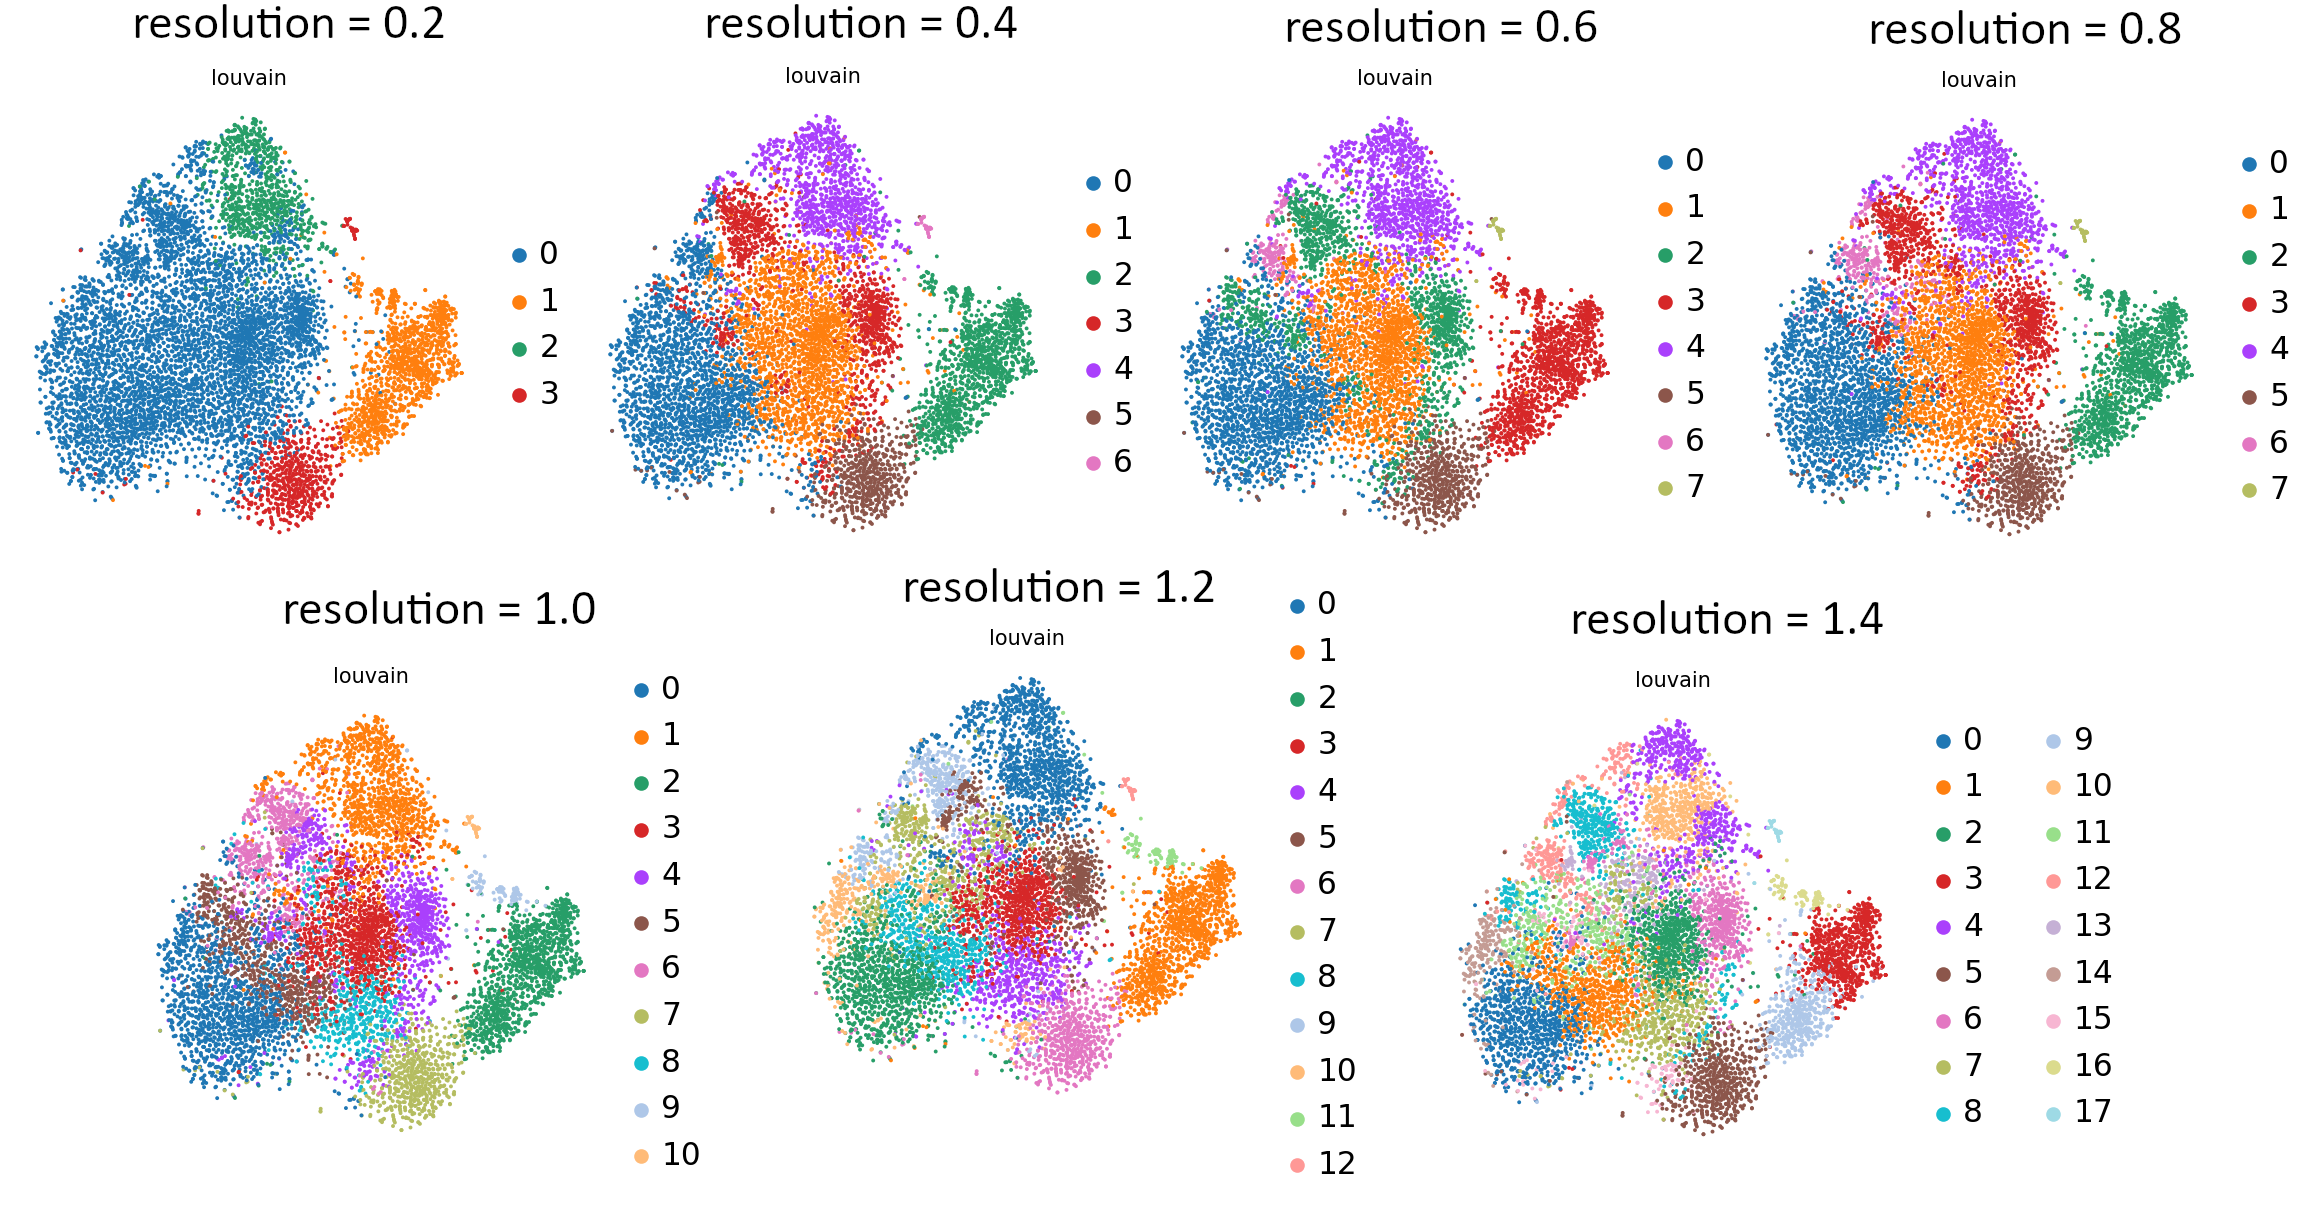 Open image in new tab
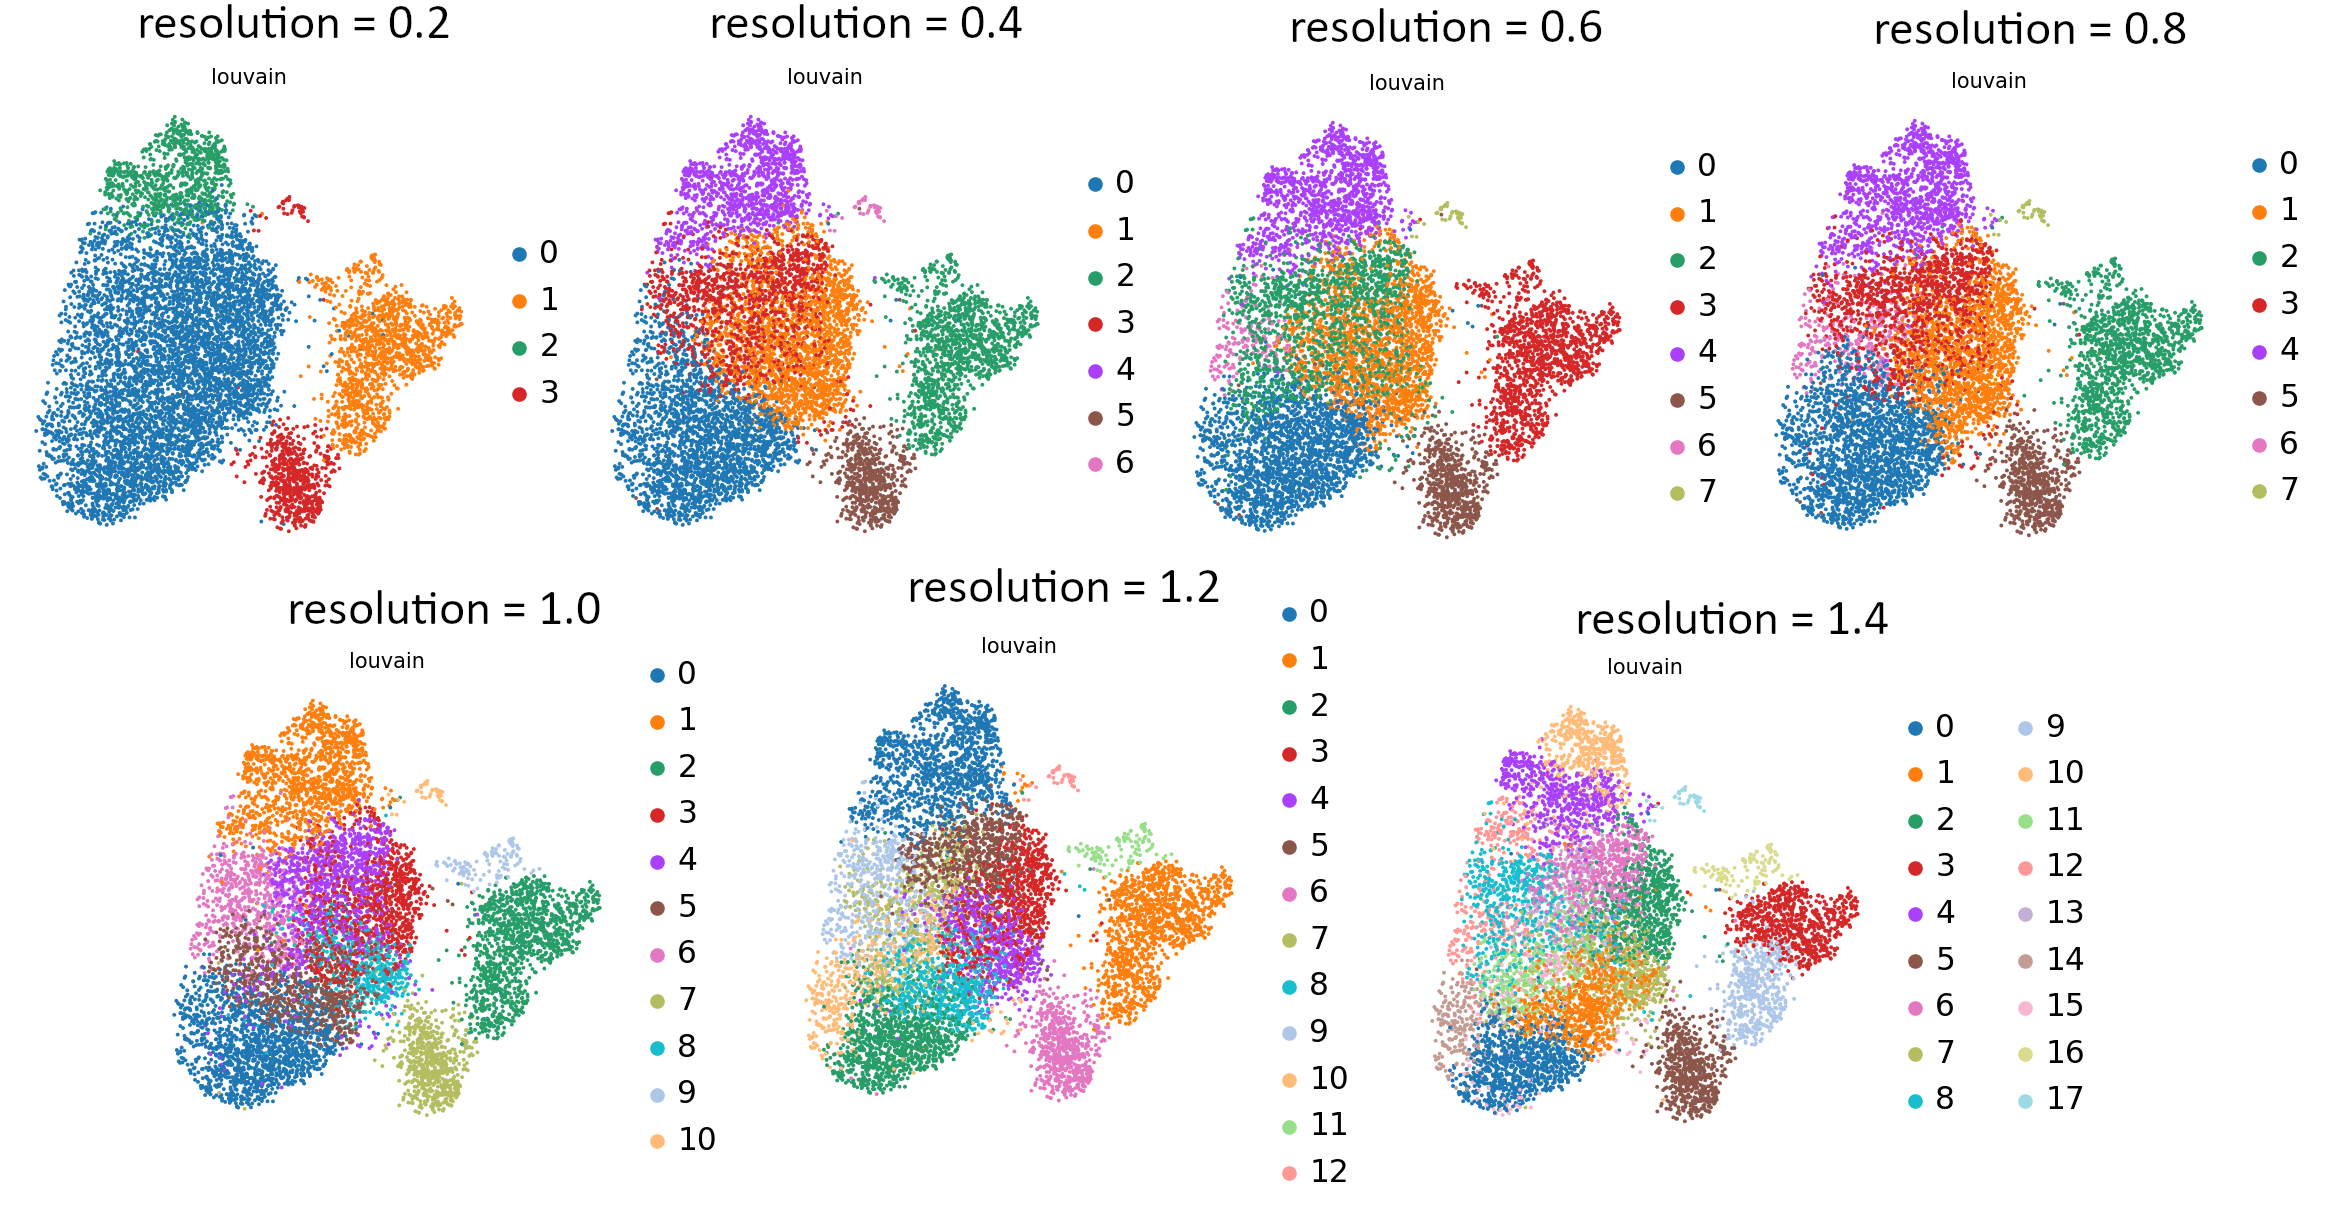 Open image in new tab
CommentStill not sure which value works best? For more explanation and in-depth analysis, please read through this tutorial. Hopefully it will give you more insight into interpretation of the resulting plots.
Additional steps
-
It may happen that some of the values you choose will give an error, but some will work fine. In that case, you can use tool Filter failed datasets tool to remove datasets with errors from a collection.
-
If you still haven’t found an answer that would help you with the parameter iteration in your own analysis, check out another workflow which has some extra steps, not directly related to our analysis. But it might contain steps that would be helpful for you.
Conclusion
You might want to compare your results with this control history, or check out the workflow for this tutorial. You can also continue to analyse this data by returning to the Filter, Plot and Explore tutorial.
congratulations You have finished the tutorial! You have learned how to use the Parameter Iterator with the nearest neighbours, perplexity and resolution parameters. You also compared multiple outputs resulting from the analysis using different values at three different steps (Scanpy ComputeGraph, Scanpy RunTSNE and Scanpy FindCluster). Hopefully this tool will help you more quickly assess parameter values, ultimately helping you choose values that both confirm prior knowledge as well as offer new insights on biological data.
feedback To discuss with like-minded scientists, join our Galaxy Training Network chatspace in Slack and discuss with fellow users of Galaxy single cell analysis tools on #single-cell-users
We also post new tutorials / workflows there from time to time, as well as any other news.
point-right If you’d like to contribute ideas, requests or feedback as part of the wider community building single-cell and spatial resources within Galaxy, you can also join our Single cell & sPatial Omics Community of Practice.
tool You can request tools here on our Single Cell and Spatial Omics Community Tool Request Spreadsheet
You've Finished the Tutorial
Key points
Scanpy ParameterIterator can be used for k nearest neighbours (Scanpy ComputeGraph), perplexity (Scanpy RunTSNE) and resolution (Scanpy FindCluster).
You can enter the parameter values either as a list or as values to be iterated in step.
Parameter Iterator is a useful tool to quickly and easily compare the differences in the outputs caused by changing parameter values. Hence it allows us to choose the optimal parameter values.
Frequently Asked Questions
Have questions about this tutorial? Have a look at the available FAQ pages and support channelsUseful literature
Further information, including links to documentation and original publications, regarding the tools, analysis techniques and the interpretation of results described in this tutorial can be found here.
References
- Bacon, W. A., R. S. Hamilton, Z. Yu, J. Kieckbusch, D. Hawkes et al., 2018 Single-Cell Analysis Identifies Thymic Maturation Delay in Growth-Restricted Neonatal Mice. Frontiers in Immunology 9: 10.3389/fimmu.2018.02523
Feedback
Did you use this material as an instructor? Feel free to give us feedback on how it went.
Did you use this material as a learner or student? Click the form below to leave feedback.

Citing this Tutorial
- Julia Jakiela, Scanpy Parameter Iterator (Galaxy Training Materials). https://training.galaxyproject.org/training-material/topics/single-cell/tutorials/scanpy_parameter_iterator/tutorial.html Online; accessed TODAY
- Hiltemann, Saskia, Rasche, Helena et al., 2023 Galaxy Training: A Powerful Framework for Teaching! PLOS Computational Biology 10.1371/journal.pcbi.1010752
- Batut et al., 2018 Community-Driven Data Analysis Training for Biology Cell Systems 10.1016/j.cels.2018.05.012
@misc{single-cell-scanpy_parameter_iterator,
author = "Julia Jakiela",
	title = "Scanpy Parameter Iterator (Galaxy Training Materials)",
	year = "",
	month = "",
	day = "",
	url = "\url{https://training.galaxyproject.org/training-material/topics/single-cell/tutorials/scanpy_parameter_iterator/tutorial.html}",
	note = "[Online; accessed TODAY]"
}
@article{Hiltemann_2023,
	doi = {10.1371/journal.pcbi.1010752},
	url = {https://doi.org/10.1371%2Fjournal.pcbi.1010752},
	year = 2023,
	month = {jan},
	publisher = {Public Library of Science ({PLoS})},
	volume = {19},
	number = {1},
	pages = {e1010752},
	author = {Saskia Hiltemann and Helena Rasche and Simon Gladman and Hans-Rudolf Hotz and Delphine Larivi{\`{e}}re and Daniel Blankenberg and Pratik D. Jagtap and Thomas Wollmann and Anthony Bretaudeau and Nadia Gou{\'{e}} and Timothy J. Griffin and Coline Royaux and Yvan Le Bras and Subina Mehta and Anna Syme and Frederik Coppens and Bert Droesbeke and Nicola Soranzo and Wendi Bacon and Fotis Psomopoulos and Crist{\'{o}}bal Gallardo-Alba and John Davis and Melanie Christine Föll and Matthias Fahrner and Maria A. Doyle and Beatriz Serrano-Solano and Anne Claire Fouilloux and Peter van Heusden and Wolfgang Maier and Dave Clements and Florian Heyl and Björn Grüning and B{\'{e}}r{\'{e}}nice Batut and},
	editor = {Francis Ouellette},
	title = {Galaxy Training: A powerful framework for teaching!},
	journal = {PLoS Comput Biol}
}
Funding
These individuals or organisations provided funding support for the development of this resource
Congratulations on successfully completing this tutorial!
Do you want to extend your knowledge?Follow one of our recommended follow-up trainings:
You can use Ephemeris's
shed-tools installcommand to install the tools used in this tutorial.shed-tools install [-g GALAXY] [-a API_KEY] -t <(curl https://training.galaxyproject.org/training-material/api/topics/single-cell/tutorials/scanpy_parameter_iterator/tutorial.json | jq .admin_install_yaml -r)Alternatively you can copy and paste the following YAML
---
install_tool_dependencies: true
install_repository_dependencies: true
install_resolver_dependencies: true
tools:
- name: scanpy_compute_graph
  owner: ebi-gxa
  revisions: 6417cccad133
  tool_panel_section_label: Single-cell
  tool_shed_url: https://toolshed.g2.bx.psu.edu/
- name: scanpy_find_cluster
  owner: ebi-gxa
  revisions: 2ccd9f9e2cd0
  tool_panel_section_label: Single-cell
  tool_shed_url: https://toolshed.g2.bx.psu.edu/
- name: scanpy_parameter_iterator
  owner: ebi-gxa
  revisions: 73d43034c860
  tool_panel_section_label: Single-cell
  tool_shed_url: https://toolshed.g2.bx.psu.edu/
- name: scanpy_plot_embed
  owner: ebi-gxa
  revisions: 35f6611fb8c3
  tool_panel_section_label: Single-cell
  tool_shed_url: https://toolshed.g2.bx.psu.edu/
- name: scanpy_run_tsne
  owner: ebi-gxa
  revisions: 181d61d2f3cd
  tool_panel_section_label: Single-cell
  tool_shed_url: https://toolshed.g2.bx.psu.edu/
- name: scanpy_run_umap
  owner: ebi-gxa
  revisions: bd4a244faeb8
  tool_panel_section_label: Single-cell
  tool_shed_url: https://toolshed.g2.bx.psu.edu/