Public single cell datasets seem to accumulate by the second. Well annotated, quality datasets are slightly trickier to find, which is why projects like the Single Cell Expression Atlas (SCXA) exist - to curate datasets for public use. Here, we will guide you through transforming data imported from the SCXA repository into the input file required for the Filter, Plot, Explore tutorial and we will also show how to use the public atlases for your own research.
Getting data from the Single Cell Expression Atlas
Galaxy has a specific tool for importing data from the SCXA (Moreno et al. 2020), which combines all the preprocessing steps shown in the corresponding tutorial into one! For this tutorial, the dataset can be seen at the EBI with experiment ID of E-MTAB-6945.
You can search datasets according to various criteria either using search box in Home tab or choosing kingdom, experiment collection, technology type (and others) in Browse experiments tab. When you find the experiment you are interested in, just click on it and the experiment ID will be displayed in the website URL, as shown below.
Figure 1: Where to find experiment ID on the EBI Single Cell Expression Atlas website.
Once you know the experiment ID, you can use EBI SCXA Data Retrieval tool in Galaxy!
Hands On: Retrieving data from Single Cell Expression Atlas
EBI SCXA Data Retrieval ( Galaxy version v0.0.2+galaxy2) with the following parameters:
“SC-Atlas experiment accession”: E-MTAB-6945
“Choose the type of matrix to download”: Raw filtered counts
It’s important to note that this matrix is processed somewhat through the SCXA pipeline, which is quite similar to the pre-processing that has been shown in this case study tutorial series. The resultant datasets contain any and all metadata provided by the SCXA pipeline as well as the metadata contributed by the original authors (for instance, more cell or gene annotations). So while the AnnData object generated at the end of this tutorial will be similar to that generated using the Alevin workflows on the original FASTQ files, some of the metadata will be slightly different. Relevant results and interpretation will not change, however!
Examine the imported files
Question
What format has this tool imported?
Selecting the title of each resultant dataset will expand the dataset in the Galaxy history.
Matrix Market Format! We can tell this because our first file helpfully says MatrixMarket in the first line.
This param-filematrix.mtx file, in Matrix Market format, contains a column referring to each gene (column 1), to each cell (column 2), and the expression values themselves in the final column. To be useful, then, we need to know which genes and cells the numbers are referring to. That’s why this format comes with two more files.
The param-filegenes.tsv file lists each EnsemblID and its gene name. The lines (14,457) corresponds with the 14458 in the Matrix file…but the 14458 contains a header, so that’s why it has one more than the genes file!
The param-filebarcodes.tsv file lists each barcode. The lines (5,217) again correspond with the 5,218 lines in the Matrix file…which adds in the header again!
Finally, and helpfully, the tool also includes cell metadata where the Assay column corresponds with the barcodes in the param-filebarcodes.tsv file. While this is not a required file to create an AnnData object from the three matrix market files, it is extremely necessary for actually interpreting the data. Imagine not knowing which barcodes came from which sample!
Metadata manipulation
At this point you might want to do some modifications in the files before downstream analysis. That can include re-formating the cell metadata or changing the names of the column headers, it all depends on your dataset and how you want to perfrom your analysis. It’s also fine to transform those files straight away. Here, we will show an extended version of metadata manipulation which allows us to create an input file consistent with the next tutorial workflow.
Before creating an AnnData object, we need to make a small modification in experimental design table. The dataset contains information about the 7 experimental samples (N701 – N707). However, in the param-fileexp_design.tsv dataset, which contains the cell metadata, these samples are just numbered from 1 to 7.
You can preview this column in the the param-fileexp_design.tsv dataset by selecting the galaxy-eye in the galaxy-history Galaxy history. If you scroll to the right, and move to the column Sample Characteristic[individual], you will find the batch information. Don’t worry, we’re about to rename and reformat this whole dataset to more useful titles. Make a note of the number of that column - number 12 - as we will need it to change the batch number to a batch name shortly.
The plotting tool that we will use later will fail if the entries are integers and not categorical values, so we will change 1 to N01 and so on.
Hands On: Change batch numbers into names
Change the datatype of param-fileEBI SCXA Data Retrieval on E-MTAB-6945 exp_design.tsv to tabular:
Click on the galaxy-pencilpencil icon for the dataset to edit its attributes
In the central panel, click galaxy-chart-select-dataDatatypes tab on the top
In the galaxy-chart-select-dataAssign Datatype, select tabular from “New Type” dropdown
Tip: you can start typing the datatype into the field to filter the dropdown menu
Click the Save button
Column Regex Find And Replace ( Galaxy version 1.0.3) with the following parameters:
param-file“Select cells from”: EBI SCXA Data Retrieval on E-MTAB-6945 exp_design.tsv
“using column”: Column: 12
In “Check”:
param-repeat“Insert Check”
“Find Regex”: 1
“Replacement”: N01
param-repeat“Insert Check”
“Find Regex”: 2
“Replacement”: N02
param-repeat“Insert Check”
“Find Regex”: 3
“Replacement”: N03
param-repeat“Insert Check”
“Find Regex”: 4
“Replacement”: N04
param-repeat“Insert Check”
“Find Regex”: 5
“Replacement”: N05
param-repeat“Insert Check”
“Find Regex”: 6
“Replacement”: N06
param-repeat“Insert Check”
“Find Regex”: 7
“Replacement”: N07
While we’re renaming things, let’s also fix our titles.
Hands On: Change cell metadata titles
Replace parts of text ( Galaxy version 9.3+galaxy1) with the following parameters:
param-file“Select lines from”: output from Column Regex and Replacetool
We might like to flag mitochondrial genes. They can be identified quite easily since - depending on the species and formatting convention - their names often start with mt. Since tools for flagging mitochondrial genes are often case-sensitive, it might be a good idea to check the formatting of the mitochondrial genes in our dataset.
Hands On: Check the format of mitochondrial genes names
Search in textfiles ( Galaxy version 9.3+galaxy1) with the following parameters:
param-file“Select lines from”: EBI SCXA Data Retrieval on E-MTAB-6945 genes.tsv (Raw filtered counts)
“that”: Match
“Regular Expression”: mt
“Match type”: case insensitive
“Output”: Highlighted HTML (for easier viewing)
Rename galaxy-pencil output Mito genes check
If you click on that dataset, you will see all the genes containing mt in their name. We can now clearly see that mitochondrial genes in our dataset start with mt-. Keep that in mind, we might use it in a moment!
Now we can create our single cell object!
Hands-on: Choose Your Own Tutorial
This is a 'Choose Your Own Tutorial' (CYOT) section (also known as 'Choose Your Own Analysis' (CYOA)), where you can select between multiple paths. Click one of the buttons below to select how you want to follow the tutorial
You can choose whether you want to create an AnnData object for Scanpy Analysis or an RDS object for Seurat Analysis. Galaxy has more resources for Scanpy analysis, but sometimes Seurat might have what you want. The two packages are constantly trying to outdo the other! It often depends on what is more ‘standard’ in your work environment!
Creating the AnnData object
We will do several modifications within the AnnData object so that you can follow the next tutorial.
Hands On: Create the AnnData Object
Scanpy Read10x ( Galaxy version 1.9.3+galaxy0)
Make sure you are using version 1.8.1+galaxy9 of the tool (change by clicking on tool-versions Versions button):
param-file“Expression matrix in sparse matrix format (.mtx)”: EBI SCXA Data Retrieval on E-MTAB-6945 matrix.mtx (Raw filtered counts)
“Gene table”: EBI SCXA Data Retrieval on E-MTAB-6945 genes.tsv (Raw filtered counts)
“Barcode/cell table”: EBI SCXA Data Retrieval on E-MTAB-6945 barcodes.tsv (Raw filtered counts)
“Cell metadata table”: Cell metadata
Rename galaxy-pencil output AnnData object
AnnData manipulation
We will now change the header of the column containing gene names from gene_symbols to Symbol. This edit is only needed to make our AnnData object compatible with this tutorial’s workflow. We will also flag the mitochondrial genes.
And the good news is that we can do both those steps using only one tool!
Hands On: Modify AnnData object
AnnData Operations ( Galaxy version 1.9.3+galaxy0)
Make sure you are using version 1.8.1+galaxy92 of the tool (change by clicking on tool-versions Versions button)
Set the following parameters:
param-file In “Input object in hdf5 AnnData format”: AnnData object
In “Change field names in AnnData var”:
param-repeat“Insert Change field names in AnnData var”
“Original name”: gene_symbols
“New name”: Symbol
“Gene symbols field in AnnData”: Symbol
In “Flag genes that start with these names”:
param-repeat“Insert Flag genes that start with these names”
“Starts with”: mt-
“Var name”: mito
Rename galaxy-pencil output Mito-counted AnnData for downstream analysis
And that’s all! What’s even more exciting about the toolAnnData Operations tool is that it automatically calculates a bunch of metrics, such as log1p_mean_counts, log1p_total_counts, mean_counts, n_cells, n_cells_by_counts, n_counts, pct_dropout_by_counts, and total_counts. Amazing, isn’t it?
Even though this tutorial was designed specifically to modify the AnnData object to be compatible with the subsequent tutorial, it also shows useful tools that you can use for your own, independent data analysis. You can find the workflow and the answer key history. However, if you want to use the workflow from this tutorial, you have to keep in mind that different datasets may have different column names. So you have to check them first, and only then you can modify them.
Creating the Seurat Object
Hands On: Create the Seurat Object
Seurat Read10x ( Galaxy version 4.0.4+galaxy0)
Set the following parameters:
param-file“Expression matrix in sparse matrix format (.mtx)”: EBI SCXA Data Retrieval on E-MTAB-6945 matrix.mtx (Raw filtered counts)
“Gene table”: EBI SCXA Data Retrieval on E-MTAB-6945 genes.tsv (Raw filtered counts)
“Barcode/cell table”: EBI SCXA Data Retrieval on E-MTAB-6945 barcodes.tsv (Raw filtered counts)
“Cell metadata”: Cell metadata
Rename galaxy-pencil output Seurat object
You can also choose if you want to create Seurat object, Loom or Single Cell Experiment by selecting your option in “Choose the format of the output”.
Conclusion
And you’re there! You now have a usable Seurat object for analysis with Seurat tools in your history! congratulations Congrats!
Human Cell Atlas Matrix Downloader
Another public atlas that you can use to access the datasets is Human Cell Atlas data portal. We will show you the tool in Galaxy which allows to retrieve expression matrices and metadata for any public experiment available in that repository.
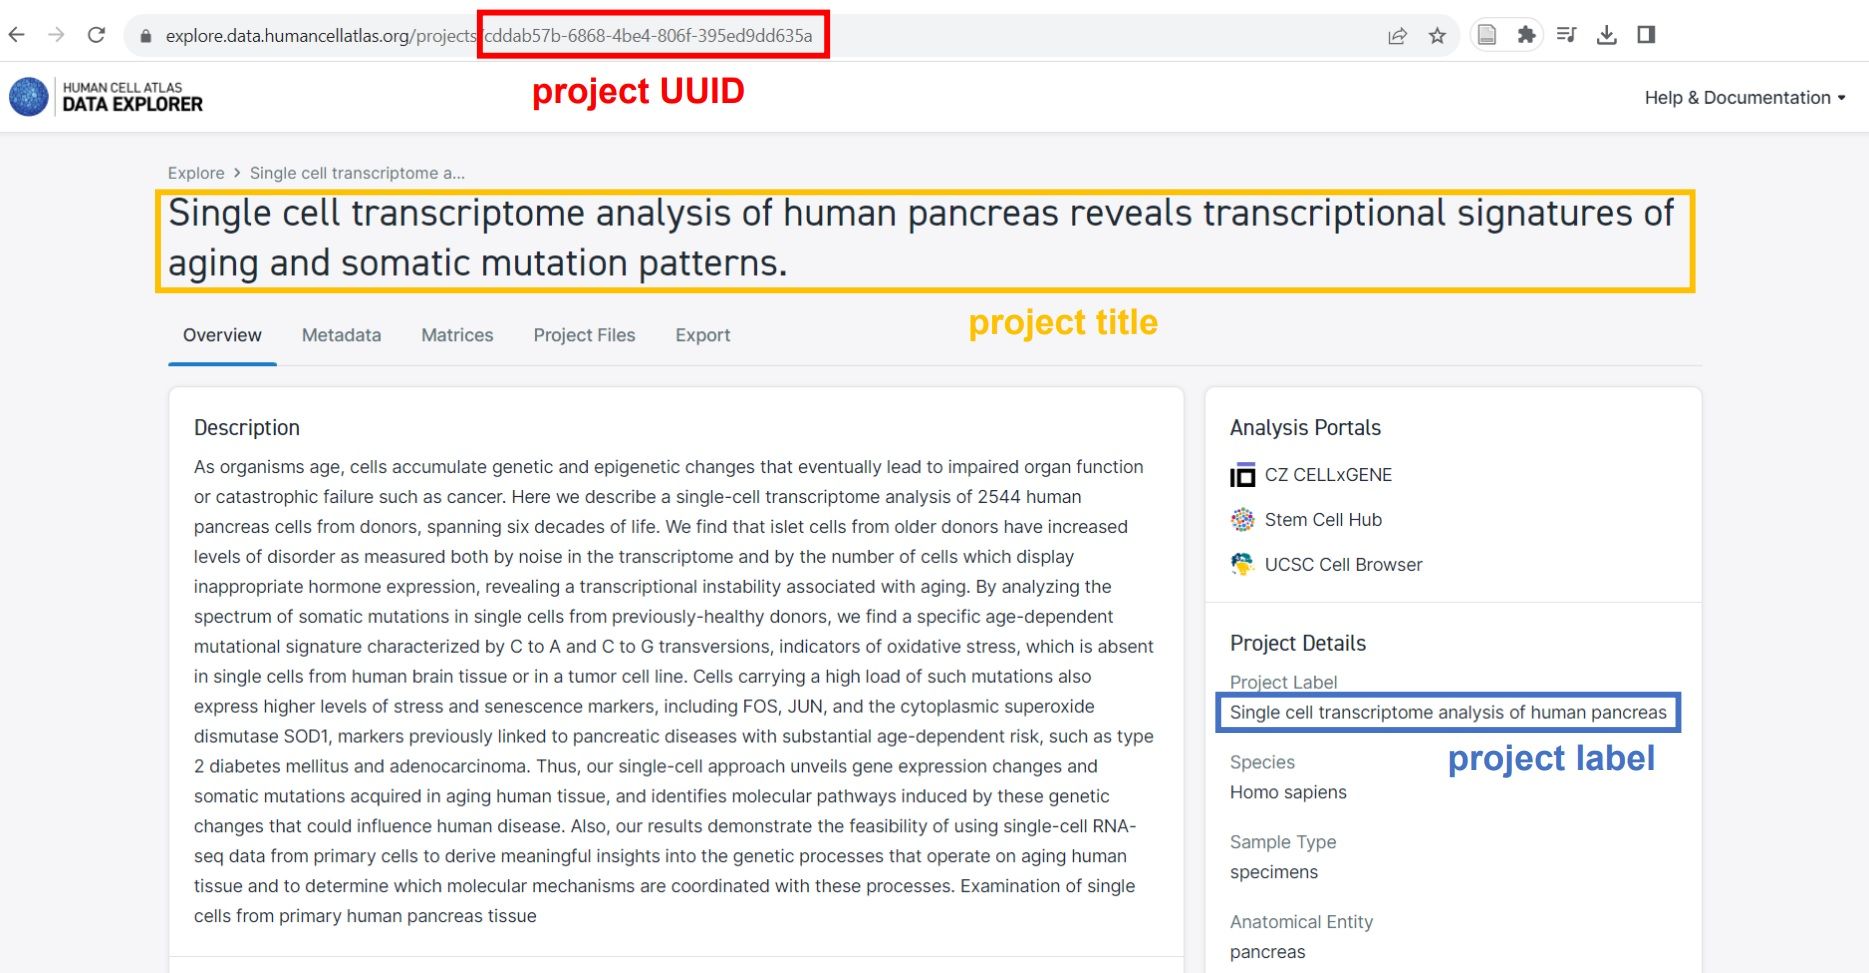
To use it, simply set the project title, project label or project UUID, which can be found at the HCA data browser, and select the desired matrix format (Matrix Market or Loom).
Figure 7: Where to find project title, project label and project UUID
For projects that have more than one organism, one needs to be specified. Otherwise, there is no need to set the species.
Let’s use the suggested example of the project Single cell transcriptome analysis of human pancreas. If you check this project in HCA, you’ll find out that it’s actually its label. But it should work well if you enter the title or UUID!
Hands On: Create AnnData object
Human Cell Atlas Matrix Downloader ( Galaxy version v0.0.4+galaxy0) with the following parameters:
“Human Cell Atlas project name/label/UUID”: Single cell transcriptome analysis of human pancreas
“Choose the format of matrix to download”: Matrix Market
Warning: Errors that you might encounter
If your dataset turns red, there might be several reasons for that, for example:
“There are too many connected users” - please be patient and re-run the step later, as it is advised
“Project identifier was not found in the database” - double check the spelling, try entering project title, project label or project UUID.
When “Matrix Market” is seleted, outputs are in 10X-compatible Matrix Market format:
Matrix (txt): Contains the expression values for genes (rows) and cells (columns) in raw counts. This text file is formatted as a Matrix Market file, and as such it is accompanied by separate files for the gene identifiers and the cells identifiers.
Genes (tsv): Identifiers (column repeated) for the genes present in the matrix of expression, in the same order as the matrix rows.
Barcodes (tsv): Identifiers for the cells of the data matrix. The file is ordered to match the columns of the matrix.
Experiment Design file (tsv): Contains metadata for the different cells of the experiment.
When “Loom” is selected, output is a single Loom HDF5 file:
Loom (h5): Contains expression values for genes (rows) and cells (columns) in raw counts, cell metadata table and gene metadata table, in a single HDF5 file.
If you chose Loom format and you need to convert your file to other datatype, you can use SCEasy ( Galaxy version 0.0.7+galaxy1) (more details in the next section). If you chose Matrix Market format, you can then transform the output to AnnData or Seurat, as shown in the EBI SCXA example above. Below, you will find an example of transforming the output to AnnData object.
Hands On: Create AnnData object
Scanpy Read10x ( Galaxy version 1.8.1+galaxy9) with the following parameters:
Make sure you are using version 1.8.1+galaxy9 of the tool (change by clicking on tool-versions Versions button)
“Expression matrix in sparse matrix format (.mtx)”: Human Cell Atlas Matrix Downloader on matrix.mtx
“Gene table”: Human Cell Atlas Matrix Downloader on genes.tsv
“Barcode/cell table”: Human Cell Atlas Matrix Downloader on barcodes.tsv
“Cell metadata table”: Human Cell Atlas Matrix Downloader on exp_design.tsv
After you create AnnData file, you can additionally use the AnnData Operations ( Galaxy version 1.8.1+galaxy92) tool (note the version 1.8.1+galaxy92) before downstream analysis. It’s quite a useful tool since not only does it flag mitochondrial genes, but also automatically calculates a bunch of metrics, such as log1p_mean_counts, log1p_total_counts, mean_counts, n_cells, n_cells_by_counts, n_counts, pct_dropout_by_counts, and total_counts.
When you use it to flag mitochondrial genes, here are some formatting tips:
Remember to check the name of the column with gene symbols
This tool is case sensitive
No parentheses needed when typing in the values
Including a dash is important to identify mitochondrial genes (eg. MT-)
You can have a look at the answer history of performing those three quick steps.
You've Finished the Tutorial
Please also consider filling out the Feedback Form as well!
Key points
The EMBL-EBI Single-cell Expression Atlas contains high quality datasets.
Metadata manipulation is key for generating the correctly formatted files.
To use Scanpy tools, you have to transform your metadata into an AnnData object.
To use Seurat tools, you have to transform your metadata into a Seurat object.
Frequently Asked Questions
Have questions about this tutorial? Have a look at the available FAQ pages and support channels
Further information, including links to documentation and original publications, regarding the tools, analysis techniques and the interpretation of results described in this tutorial can be found here.
Did you use this material as an instructor? Feel free to give us feedback on how it went.
Did you use this material as a learner or student? Click the form below to leave feedback.
Hiltemann, Saskia, Rasche, Helena et al., 2023 Galaxy Training: A Powerful Framework for Teaching! PLOS Computational Biology 10.1371/journal.pcbi.1010752
Batut et al., 2018 Community-Driven Data Analysis Training for Biology Cell Systems 10.1016/j.cels.2018.05.012
@misc{single-cell-EBI-retrieval,
author = "Julia Jakiela and Wendi Bacon",
	title = "Importing files from public atlases (Galaxy Training Materials)",
	year = "",
	month = "",
	day = "",
	url = "\url{https://training.galaxyproject.org/training-material/topics/single-cell/tutorials/EBI-retrieval/tutorial.html}",
	note = "[Online; accessed TODAY]"
}
@article{Hiltemann_2023,
	doi = {10.1371/journal.pcbi.1010752},
	url = {https://doi.org/10.1371%2Fjournal.pcbi.1010752},
	year = 2023,
	month = {jan},
	publisher = {Public Library of Science ({PLoS})},
	volume = {19},
	number = {1},
	pages = {e1010752},
	author = {Saskia Hiltemann and Helena Rasche and Simon Gladman and Hans-Rudolf Hotz and Delphine Larivi{\`{e}}re and Daniel Blankenberg and Pratik D. Jagtap and Thomas Wollmann and Anthony Bretaudeau and Nadia Gou{\'{e}} and Timothy J. Griffin and Coline Royaux and Yvan Le Bras and Subina Mehta and Anna Syme and Frederik Coppens and Bert Droesbeke and Nicola Soranzo and Wendi Bacon and Fotis Psomopoulos and Crist{\'{o}}bal Gallardo-Alba and John Davis and Melanie Christine Föll and Matthias Fahrner and Maria A. Doyle and Beatriz Serrano-Solano and Anne Claire Fouilloux and Peter van Heusden and Wolfgang Maier and Dave Clements and Florian Heyl and Björn Grüning and B{\'{e}}r{\'{e}}nice Batut and},
	editor = {Francis Ouellette},
	title = {Galaxy Training: A powerful framework for teaching!},
	journal = {PLoS Comput Biol}
}
Funding
These individuals or organisations provided funding support for the development of this resource
Questions:
Open image in new tab
Open image in new tab
Open image in new tab
Open image in new tab
Open image in new tab
Open image in new tab
 Open image in new tab