rating Rating:4.7 (62 recent ratings, 435 all time)
version Revision: 68
This tutorial aims to familiarize you with the Galaxy user interface. It will teach you how to perform basic tasks such as importing data, running tools, working with histories, creating workflows, and sharing your work.
Comment: Results may vary
Your results may be slightly different from the ones presented in this tutorial due to differing versions of tools, reference data, external databases, or because of stochastic processes in the algorithms.
We start with the question: In human chromosome 22, which exon has the highest number of single nucleotide polymorphisms (SNPs)?
Comment: Background
Not everyone has the same background and that’s ok! You may have studied different organisms with different gene models, or you may not be familiar with the biological aspect at all. The biological background is not necessary for following this tutorial, we just like to provide research context for any tutorial. Here are brief explanations of some of the concepts mentioned in this tutorial:
Nucleotides are the A, C, T, and Gs that make up DNA.
Chromosomes can be thought of as a very long piece of DNA (string of A, C, T, Gs) Some organisms have chromosomes, in this tutorial we will use Human chromosome number 22.
Features are regions of the chromosome that are interesting for one reason or another. Some examples of features include genes, terminators, transcription start sites, and repeat regions.
Genes are one kind of interesting feature, a region that will be transcribed into RNA before being translated into proteins.
Exons are fundamental components of eukaryoticgenes. A typical eukaryotic gene contains numerous exons separated by introns. An entire gene containing both exons and introns is transcribed into a pre-messenger RNA or pre-mRNA. During maturation introns are excised from the pre-mRNA in a process called splicing. A mature messenger RNA, or simply mRNA, is then translated into protein during the process of translation.
Figure 1: An original piece of DNA containing introns and exons has the introns cut out before the exons are joined together to form the mRNA. (Image from WikiMedia, under the Public Domain)
SNP is an abbreviation for single-nucleotide polymorphism. It is pronounced as “snip”. SNPs are single nucleotide differences between a sequenced individual compared to some reference sequence; where one individual might have an A, another could have a C in that position. Databases of SNPs have been created for many organisms and they include any single nucleotide deviation from the reference sequence which appears in some percentage of the population (e.g. >1%). These are often especially interesting to geneticists as the causes of certain inheritable diseases.
You may be familiar with the UCSC Genome Browser or another resource like it, and know that you can find the data there.
But even with your data in hand, you still have the question: “how do I actually compute this?” There is really a straightforward answer: Galaxy. So let’s try it…
Get your workspace ready
Browse to your favorite Galaxy instance and log in or register.
To create an account at any public Galaxy instance, choose your server from the available list of Galaxy Platforms.
Click on “Login or Register” in the masthead on the server.
On the login page, find the Register here link and click on it.
Fill in the the registration form, then click on Create.
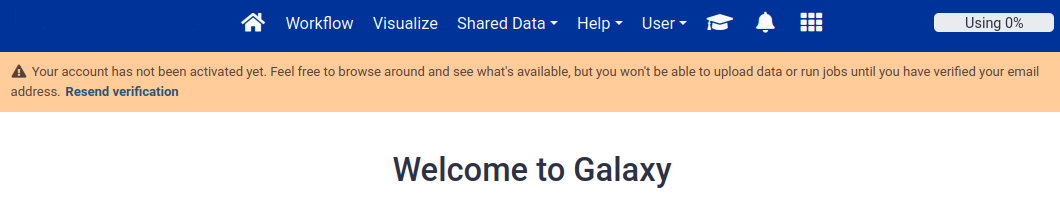
Your account should now get created, but will remain inactive until you verify the email address you provided in the registration form.
Check for a Confirmation Email in the email you used for account creation.
Missing? Check your Trash and Spam folders.
Click on the Email confirmation link to fully activate your account.
galaxy-info Delivery of the confimation email is blocked by your email provider or you mistyped the email address in the registration form?
Please do not register again, but follow the instructions to change the email address registered with your account! The confirmation email will be resent to your new address once you have changed it.
Trouble logging in later? Account email addresses and public names are caSe-sensiTive. Check your activation email for formats.
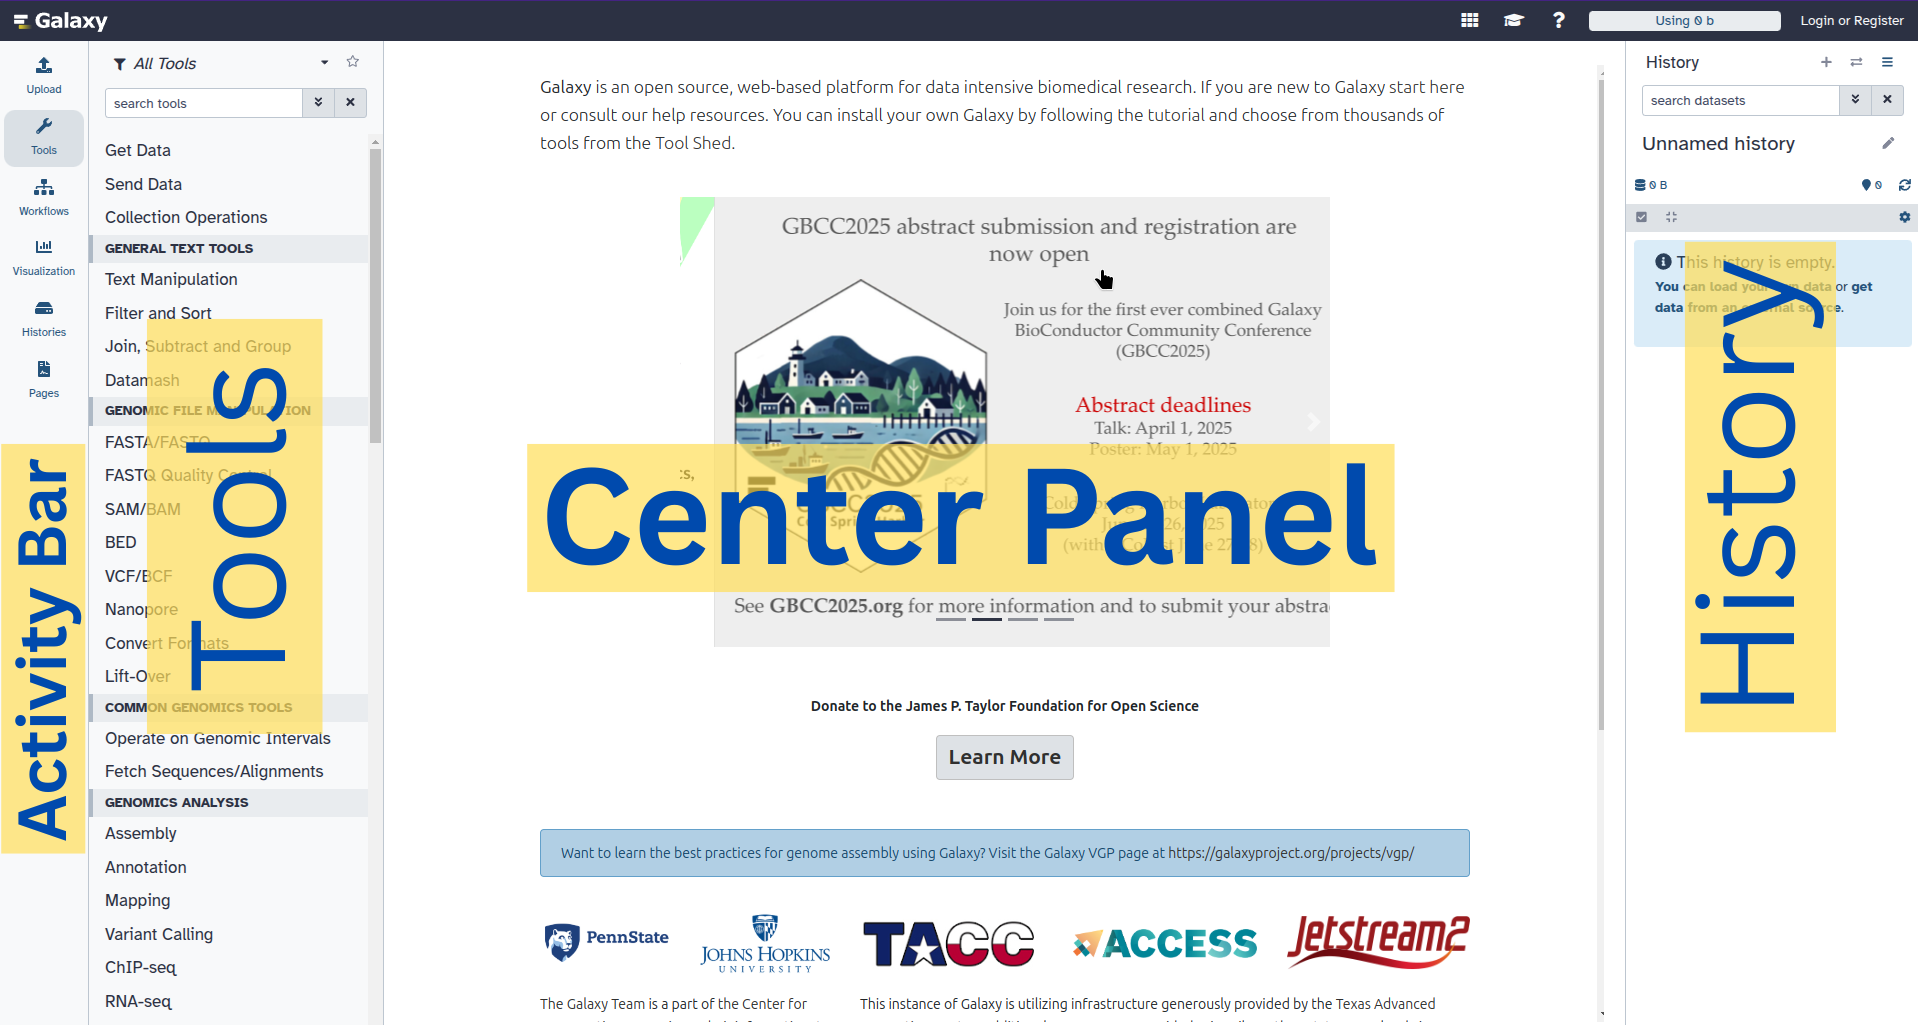
The Galaxy interface consists of three main parts:
The available Tools are listed on the left
The Central Panel will let you run analyses and view outputs
Figure 2:Galactic triptych: the three panels of Galaxy interface: Tools, Center Panel, and History. Here you also see the 'Activity bar' that can be turned on and off (Don't see the Activity Bar? See a Tip below).
If you do not see the Activity Bar it can be enabled as follows:
Click on the “User” link at the top of the Galaxy interface
Select “Preferences”
Scroll down and click on “Manage Activity Bar”
Toggle the “Enable Activity Bar” switch and voila!
When you start Galaxy for very first time, your history will be empty. Let’s add some data to it.
Hands On: Create history
Make sure you start from an empty analysis history.
To create a new history simply click the new-history icon at the top of the history panel:
Rename your history to be meaningful and easy to find. You can do this by clicking on the title of the history (which by default is Unnamed history) and typing Galaxy 101 as the name. Do not forget to hit the Enter key on your keyboard to save it.
Analysis
Locate Exons
First we need to get some data into our history. You can upload files from your computer, or Galaxy can also fetch data directly from external sources. We know UCSC has exon locations for humans and we can use Galaxy to import the data for chromosome 22, directly from the UCSC table browser.
Hands On: Upload SNPs and Exons
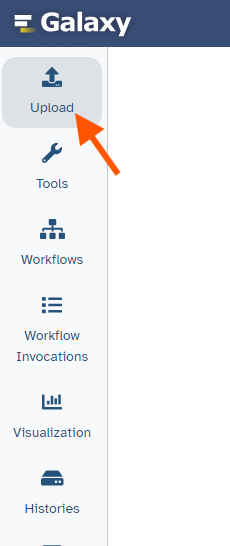
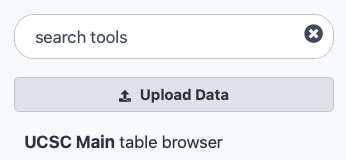
At the top of the Tools panel (on the left), click galaxy-uploadUpload Data
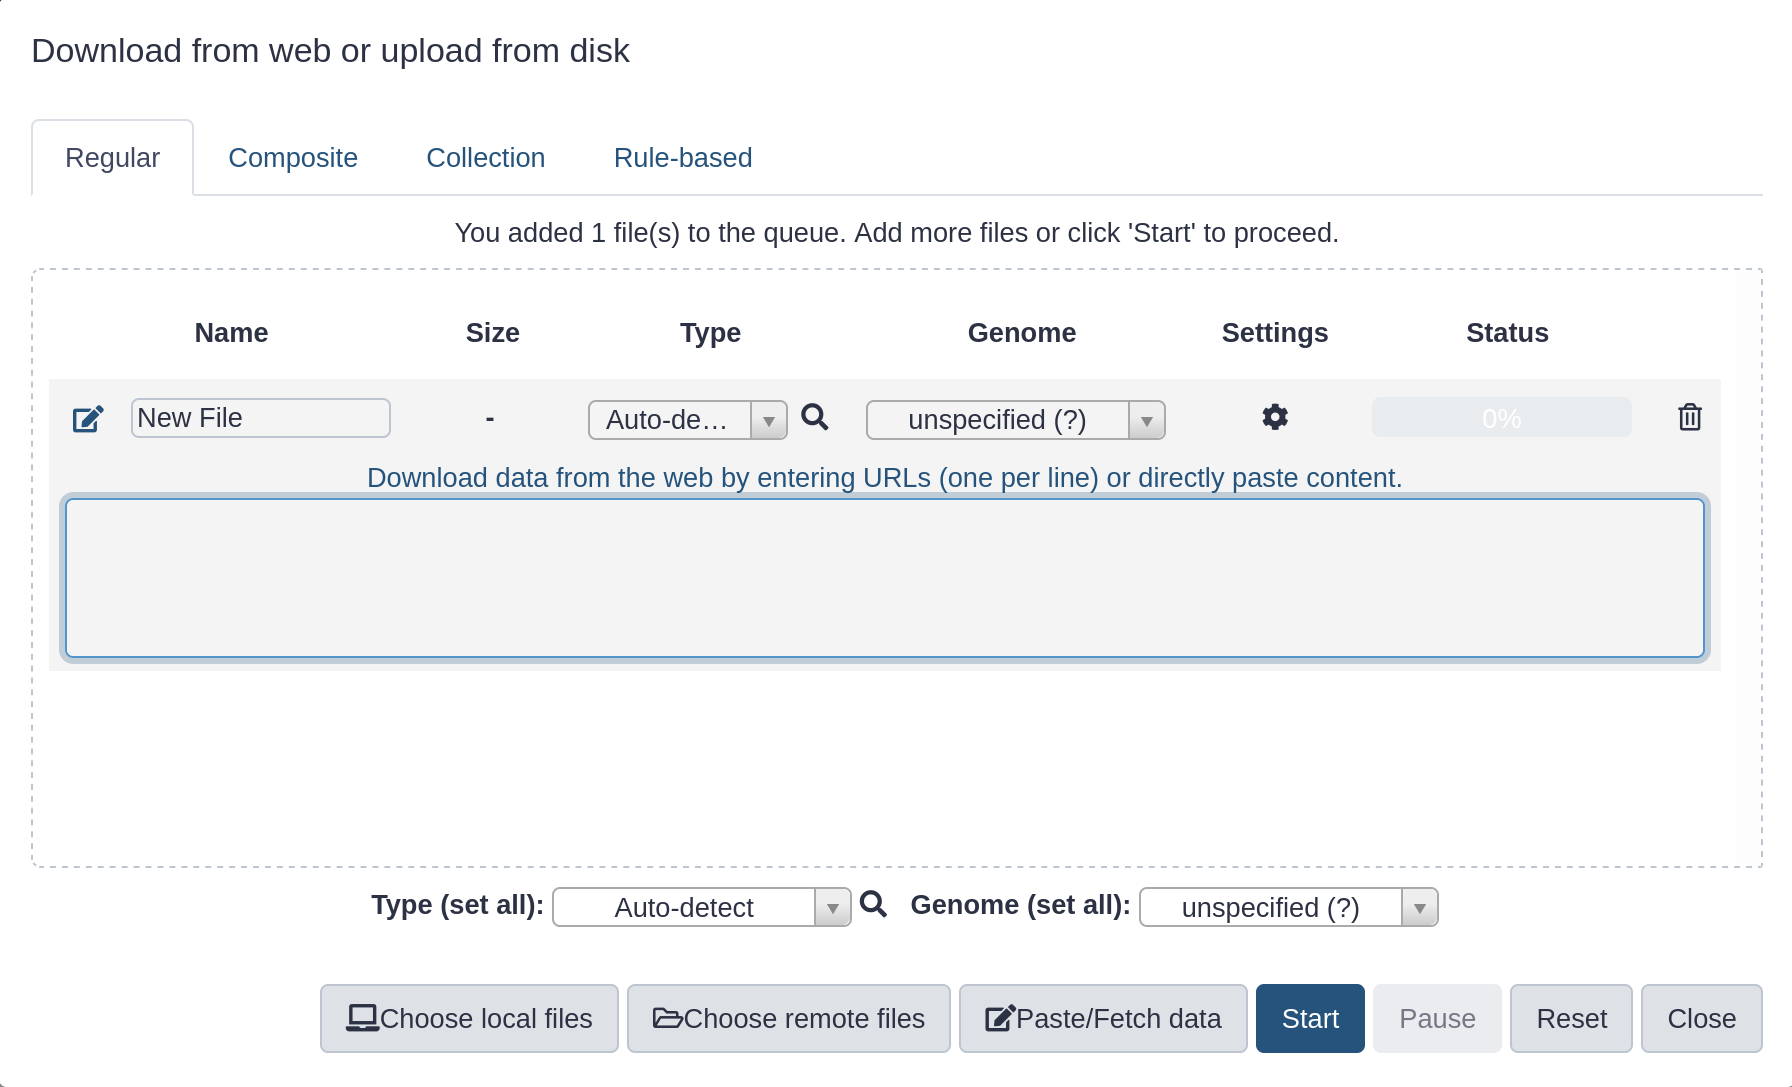
This brings up the upload interface:
Click Paste/Fetch data and paste in the following URLs in the box that appears.
When they are ready, renamegalaxy-pencil the datasets to Exons and SNPs, respectively.
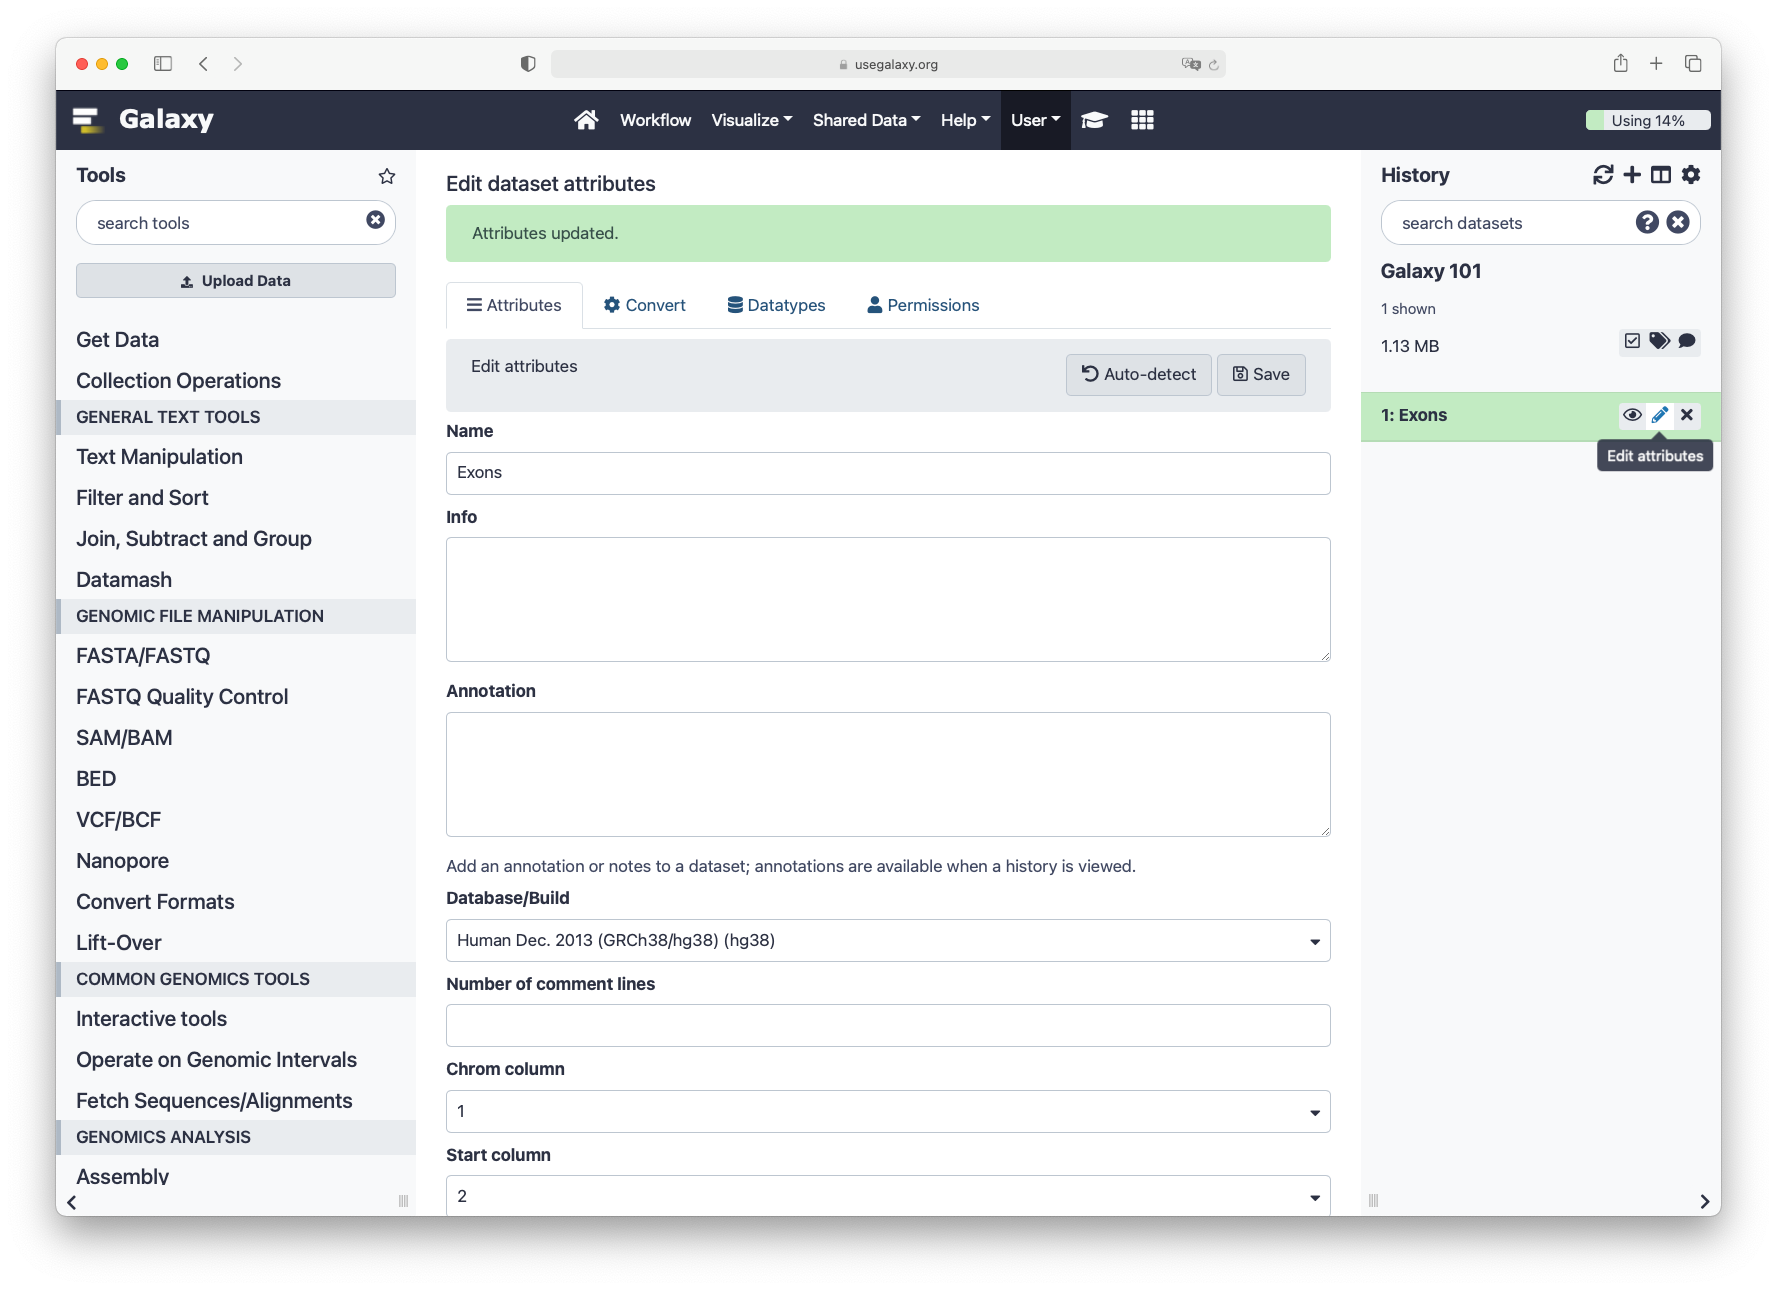
Click on the galaxy-pencilpencil icon for the dataset to edit its attributes
In the central panel, change the Name field
Click the Save button
For this tutorial, we made the input datasets available on Zenodo for you. However, these datasets can also obtained directly from UCSC, without leaving Galaxy.
Below we describe how you can do this, but it is not necessary for this tutorial. Note that since the data in UCSC is updated frequently, you might get slightly different results in the rest of this tutorial if you use these files.
Comment
In order to get the datasets from the UCSC server, you need to have an account in an instance.
This tool works a bit differently than most Galaxy tools, but if you wish to obtain the newest data from UCSC, you can do that as follows:
Hands On: Obtaining Exons from UCSC
UCSC Maintool table browser:
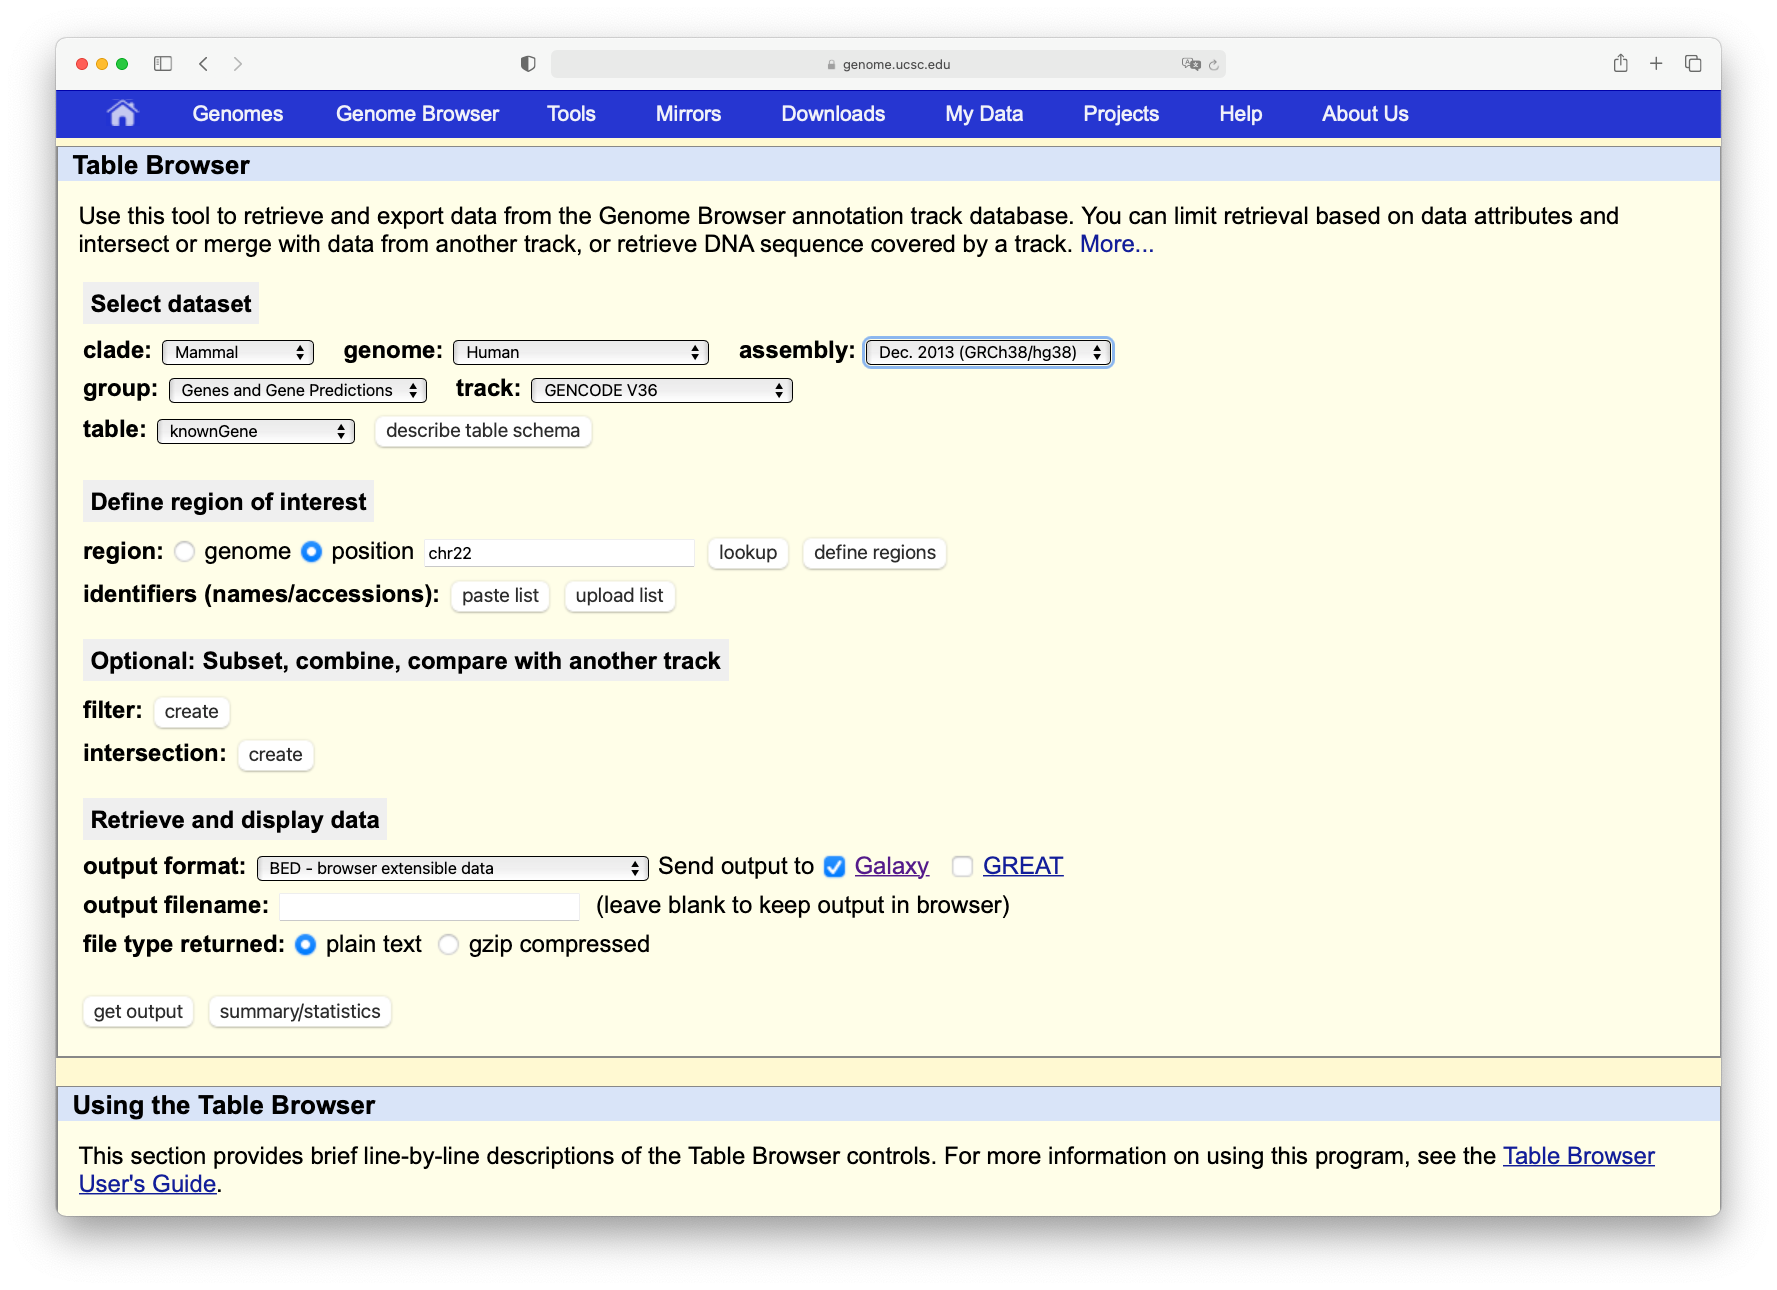
In the tool menu, navigate to Get Data -> UCSC Main table browser
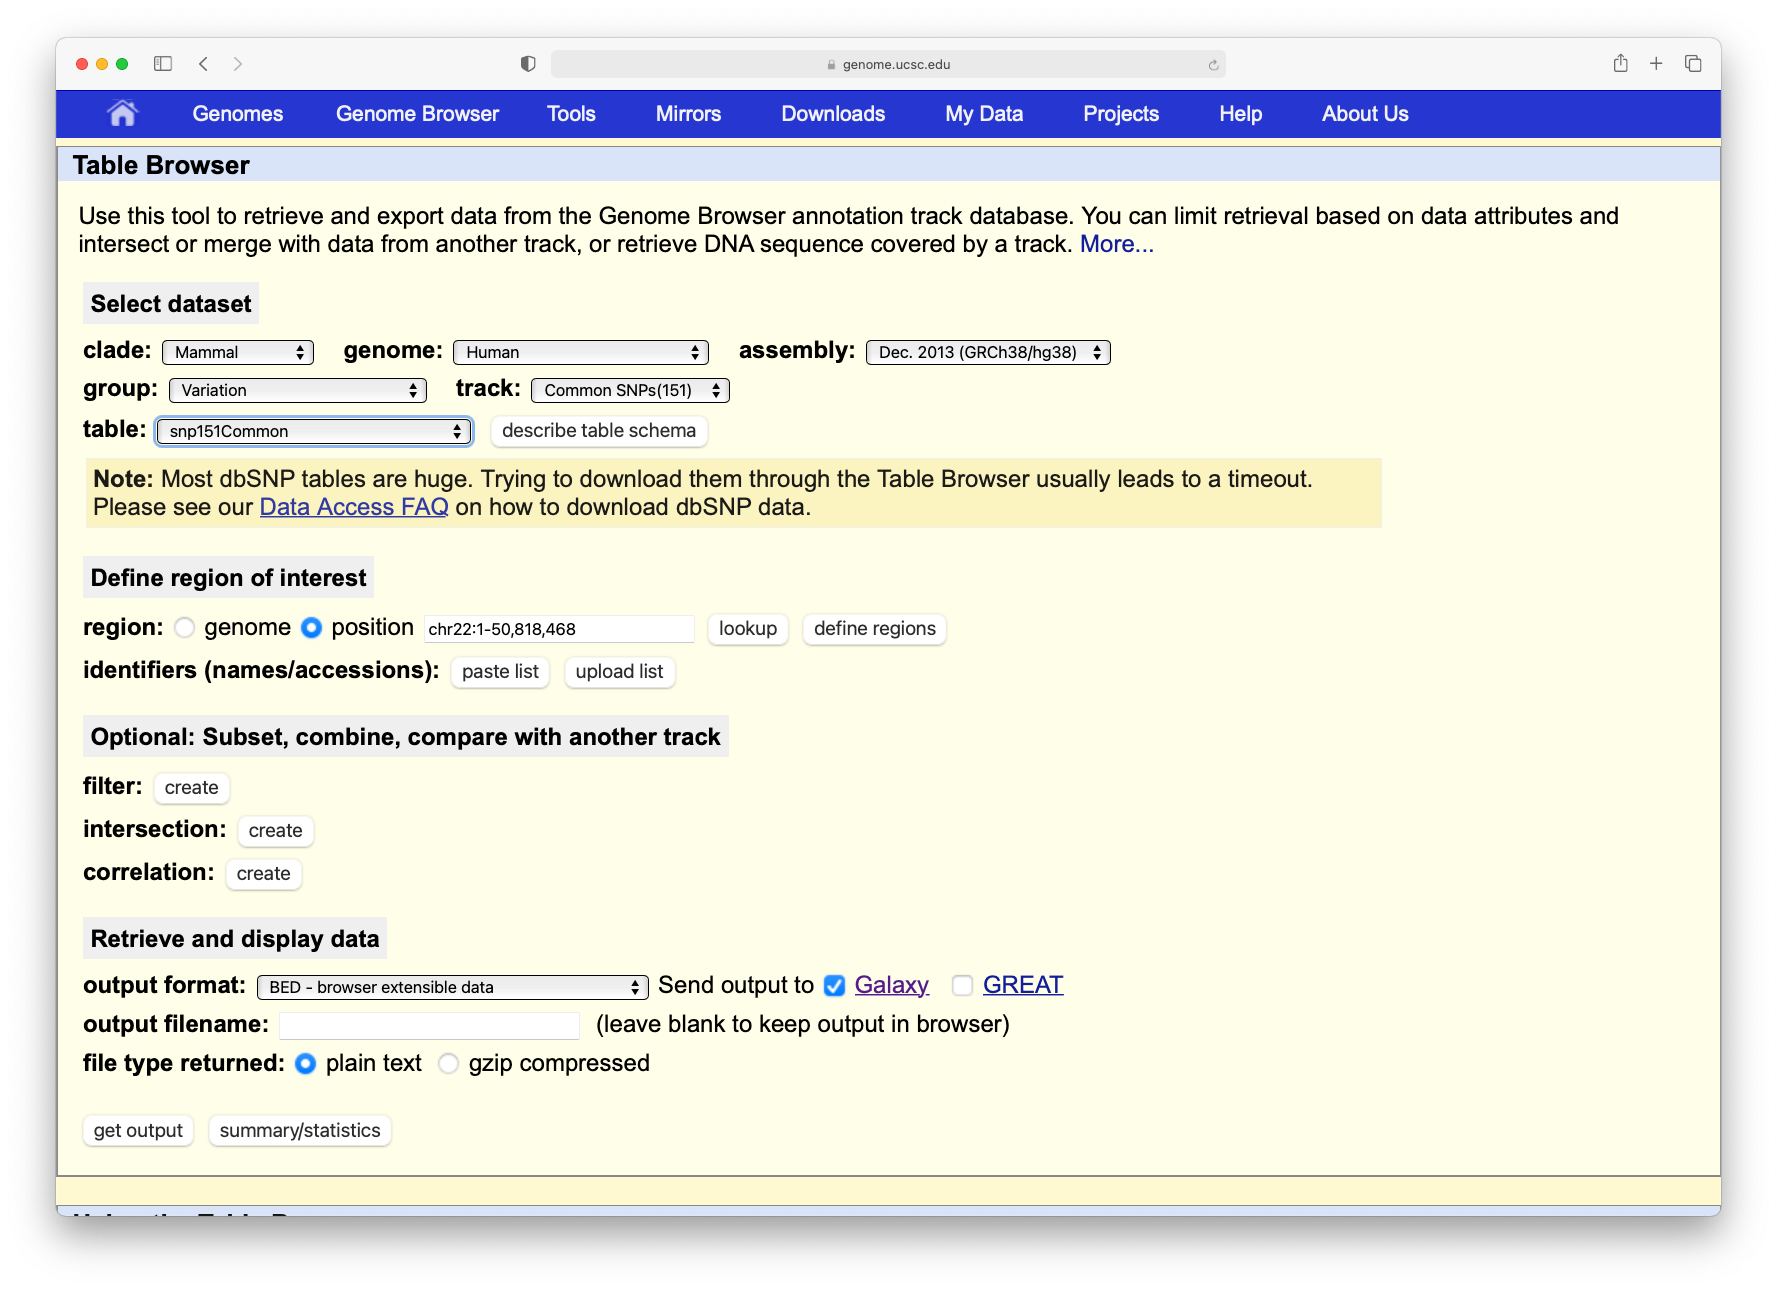
When you click on this tool, you will be taken to the UCSC table browser, which looks something like this:
Now set the following parameters:
“clade”: Mammal
“genome”: Human
“assembly”: Dec. 2013 (GRCh38/hg38)
“group”: Genes and Gene Predictions
“track”: GENCODE v36 (or a more recent version)
“table”: knownGeneV36
param-text“region” should be changed to position with value chr22
“output format” should be changed to BED - browser extensible data
param-check“Send output to” should have the option Galaxy checked
Comment
If the “table” drop down menu does not show the knownGene option. Set “group” to All tables and scroll down.
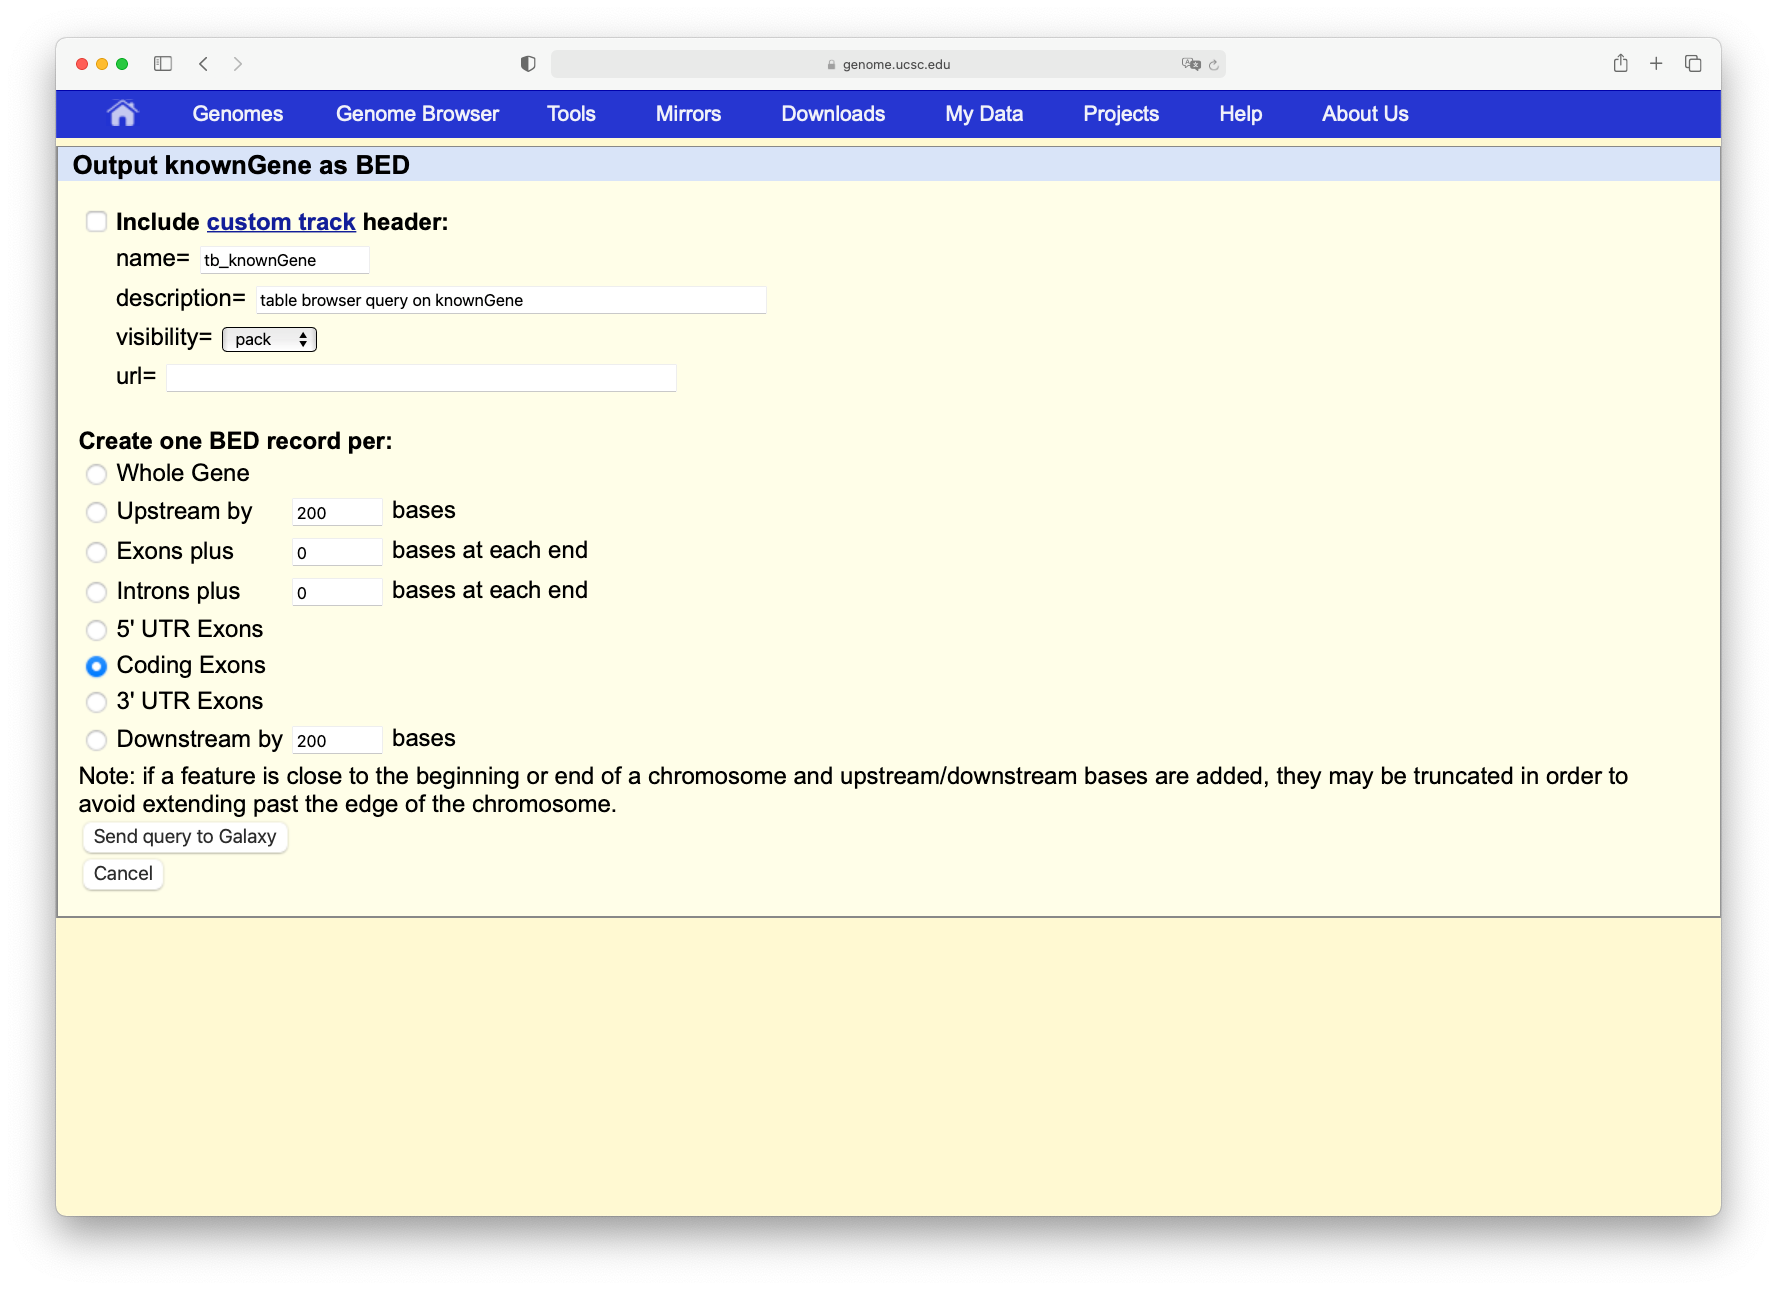
Click on the Get output button and you will see the next screen:
Change Create one BED record per to Coding Exons and then click on the Send query to Galaxy button.
Comment
After this you will see your first history item in Galaxy’s right panel. It will go through
the gray (preparing/queued) and yellow (running) states to become green (success):
You might need to login to Galaxy again.
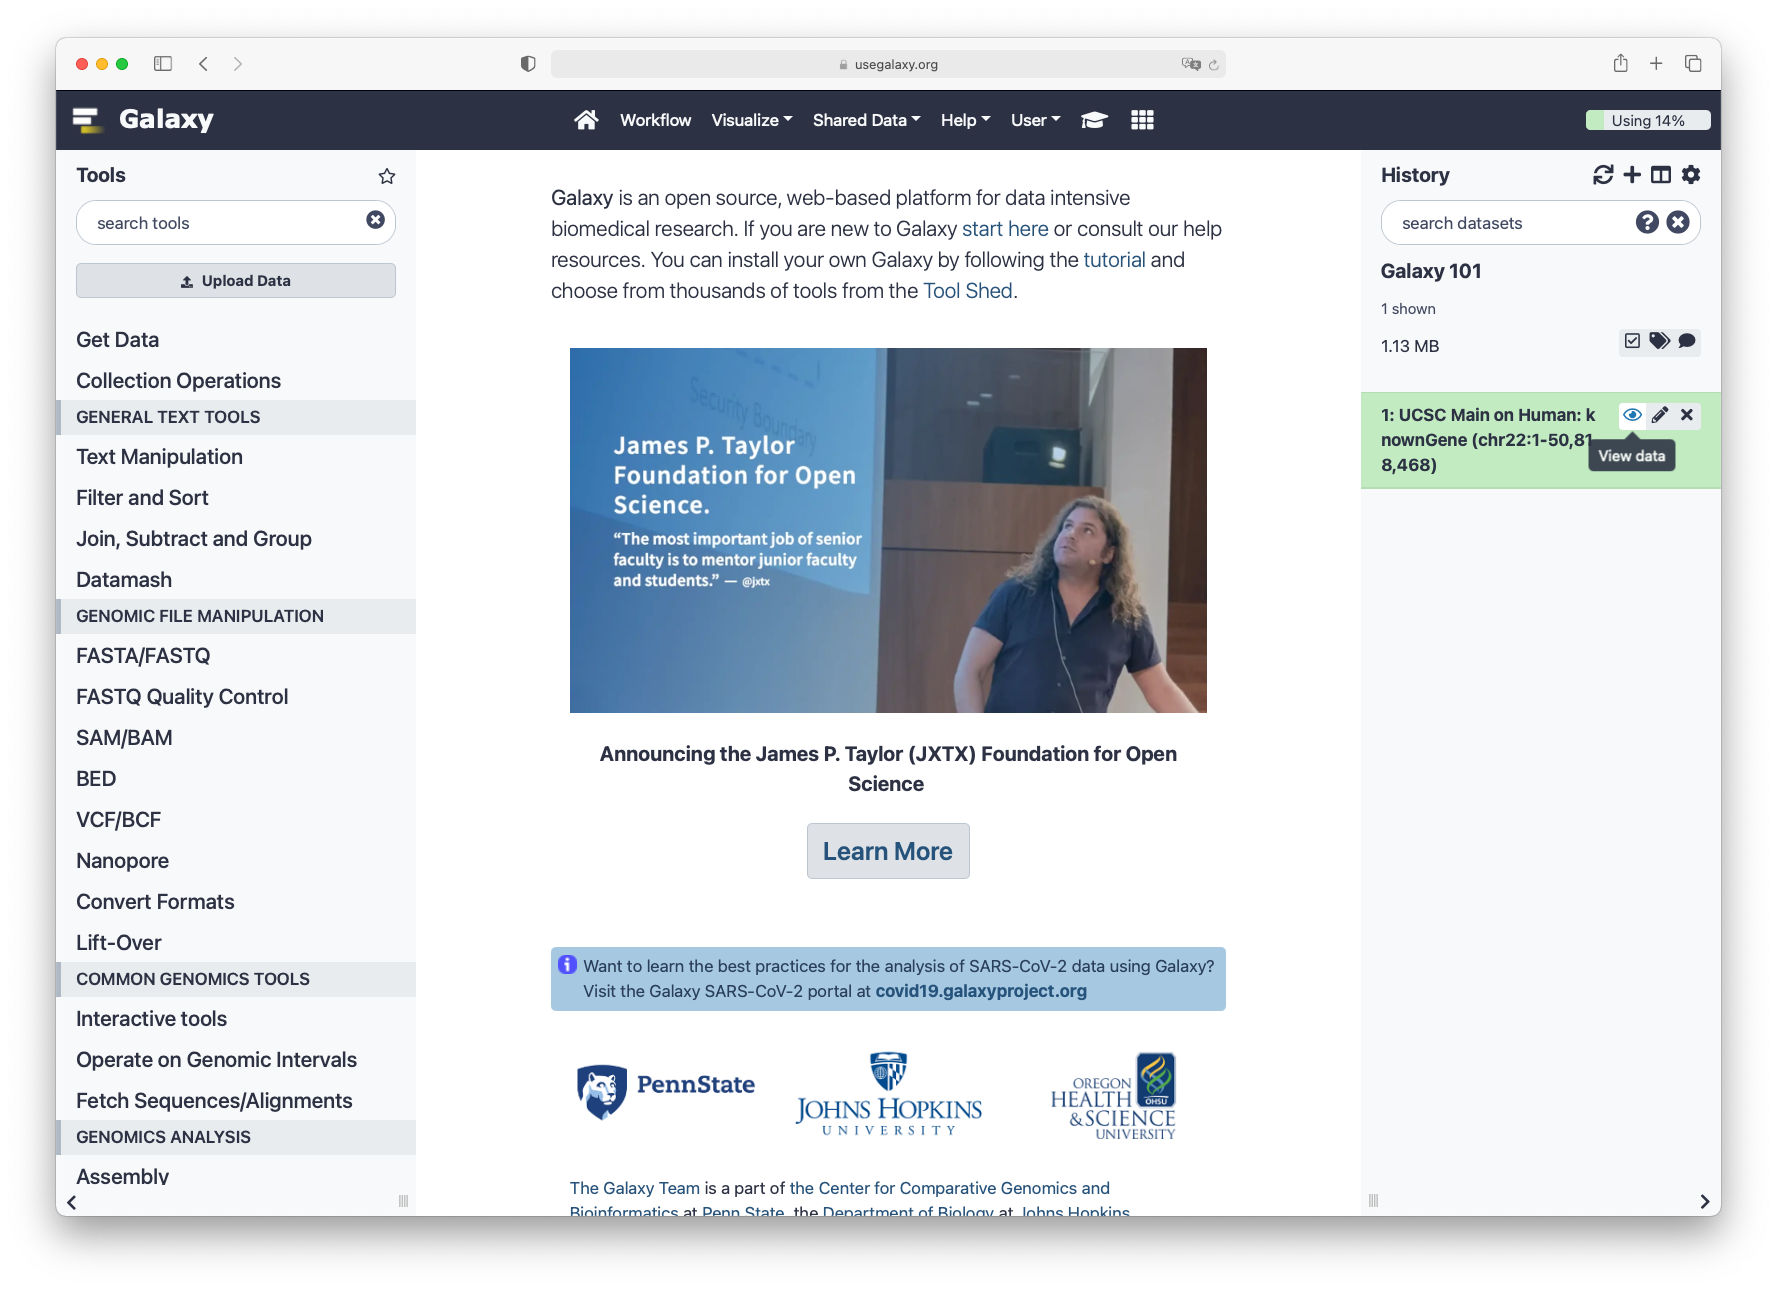
When the dataset is green, click on the galaxy-eye (eye) icon to view the contents of the file. It should look something like this:
Each line represents an exon, the first three columns are the genomic location, and the fourth column contains the name of the exon.
Let’s rename our dataset to something more recognizable.
Click on the galaxy-pencilpencil icon for the dataset to edit its attributes
In the central panel, change the Name field to Exons
Click the Save button
Your history should now look something like this:
We now have information about the exon locations, but our original question was which exon contains the largest number of SNPs, so let’s get some information about SNP locations from UCSC as well:
Hands On: Obtaining SNPs from UCSC
Again, search for UCSC Main table browser Browser on the tools search bar tool and set the following parameters
UCSC Maintool table browser:
“group” should be changed to Variation
param-text“region” should be changed again to position with value chr22
“output format” should be changed again to BED - browser extensible data
The “track” setting shows the version of the SNP database to get. In this example it is version 151, but you may select the latest one. Your results may vary slightly from the ones in this tutorial when you select a different version, but in general it is a good idea to select the latest version, as this will contain the most up-to-date SNP information.
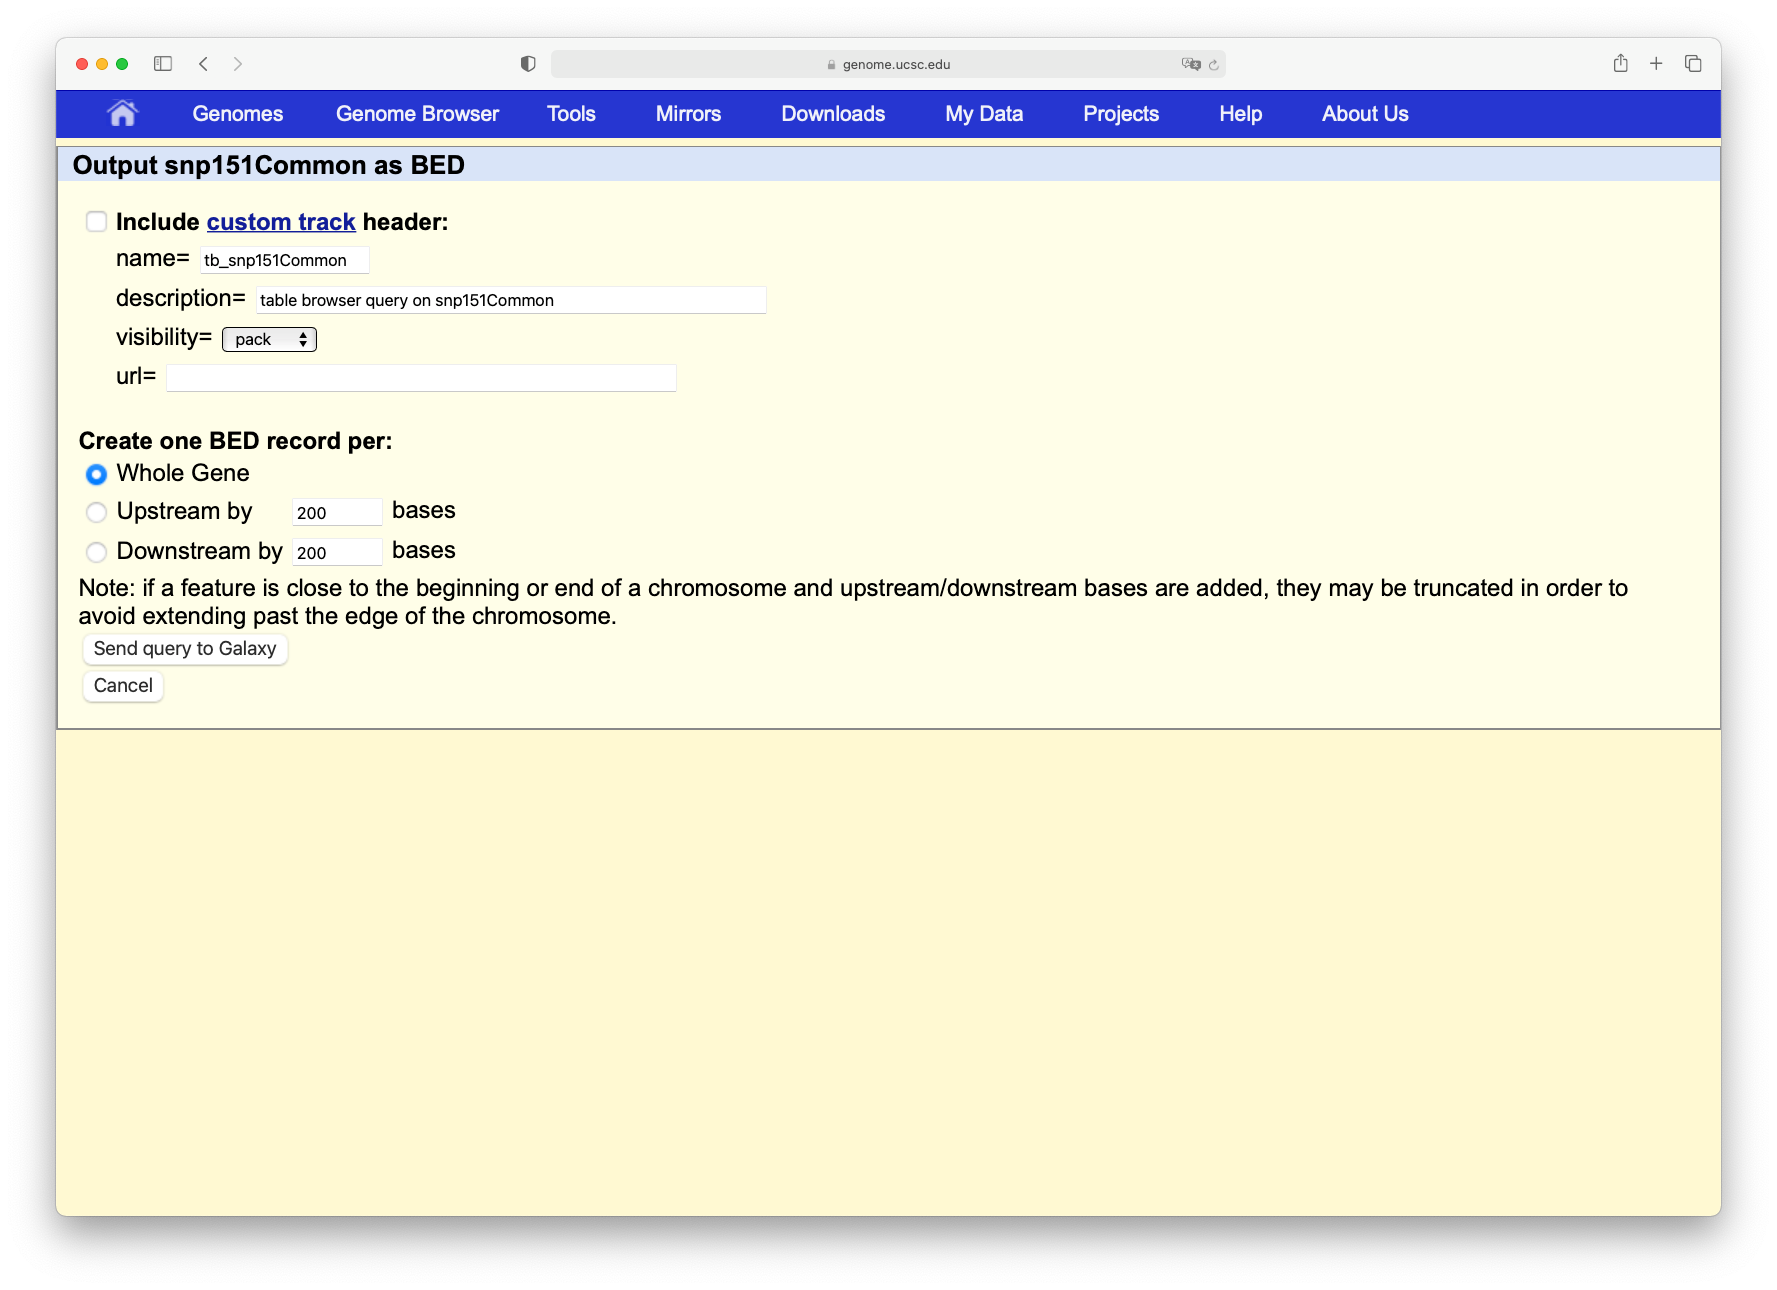
Click on the Get output button to find a form similar to this:
Make sure that “Create one BED record per” is set to Whole Gene (Whole Gene here really means Whole Feature), and click on Send query to Galaxy. A second item will appear in your analysis history.
Now renamegalaxy-pencil your new dataset to SNPs so we can easily remember what the file contains.
Find exons with the most SNPs
Our objective is to find which exon contains the most SNPs. Therefore we have to intersect the file with the exon locations with the file containing the SNP locations (here “intersect” is just a fancy word for printing SNPs and exons that overlap side-by-side).
Comment: Search bar
Different Galaxy servers may have tools available under different sections, therefore it is often useful to use the search bar at the top of the tool panel to find your tool.
Additionally different servers may have multiple, similarly named tools which accomplish similar functions. For these tutorials, you should select precisely the one that is described. However, in your real analyses, you’ll need to search among the various options to find the one that works for you.
Hands On: Finding Exons
To find intersection we will be using intersect intervalsbedtools intersect intervals ( Galaxy version 2.31.1+galaxy0) from BEDTools package.
bedtools intersect intervals ( Galaxy version 2.31.1+galaxy0) find overlapping the intervals in various ways:
If you opened the tutorial on any usegalaxy.* instance, you can click on the tool name and will open the correct tool with correct version. Or, you can search for this tool yourself. Enter the word intersect in the search bar of the tool panel, and select the
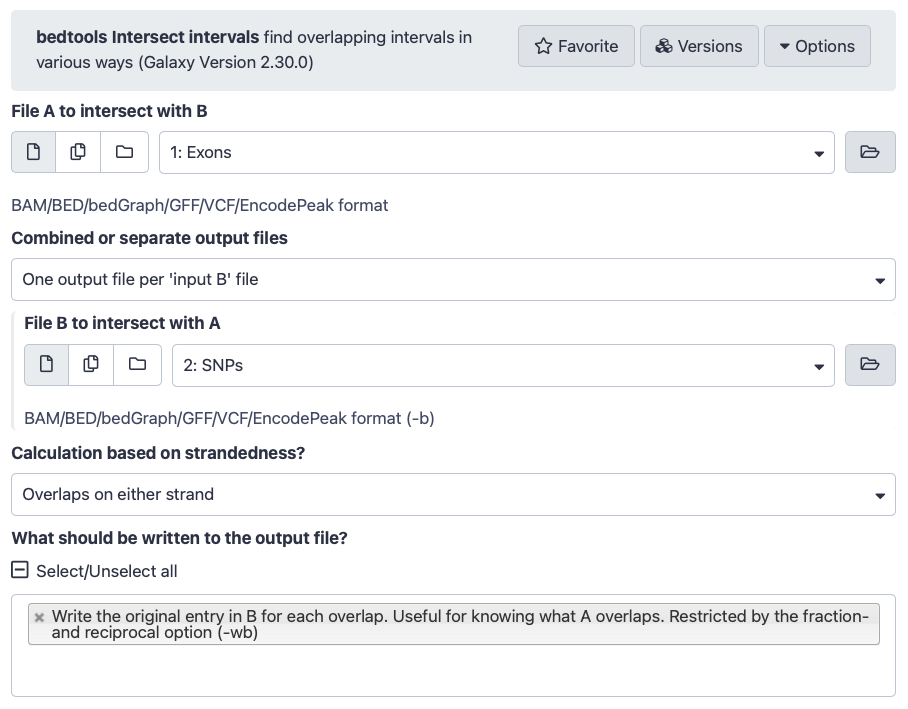
tool named bedtools Intersect intervals
“File A to intersect with B”: Select Exons
“Combined or separate output files”: Select One output file per 'input B' file"
“File B to intersect with A”: SNPs
“What should be written to the output file?”: Write the original entry in B for each overlap..., which means that only matches are included in the output (i.e. only exons with SNPs in it and only SNPs that fall in exons)
The interface of the tool should look like this:
Click Run Tool.
Wait for the job to finish.
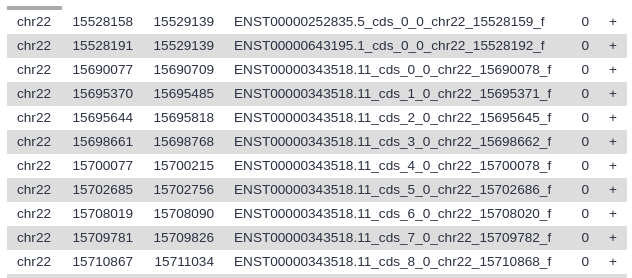
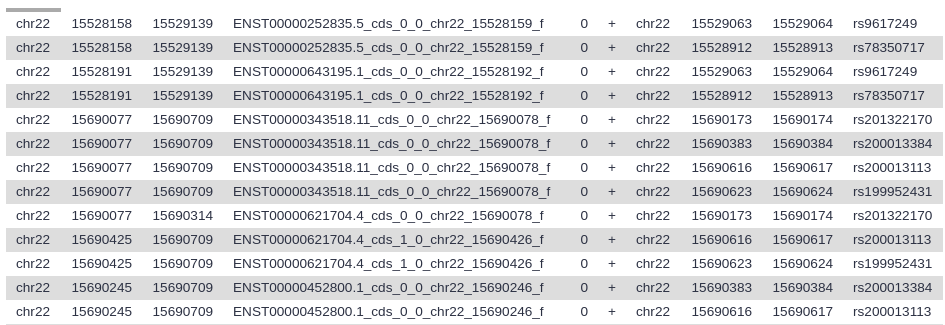
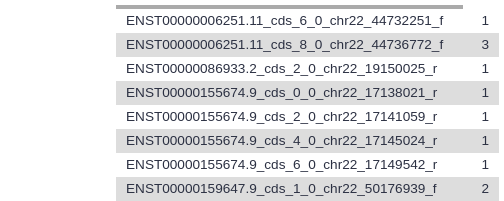
View the resulting file (with the galaxy-eye (eye) icon). If everything went okay, you should see a file that looks similar to this:
Here column 4 contains exon IDs (e.g., ENST00000252835.5_cds_0_0_chr22_15528159_f) and column 10 lists SNP IDs (e.g., rs9617249). Remember that variations are possible due to using different versions of UCSC databases: as long as you have similar looking columns you did everything right!
All Galaxy tools include documentation. If you scroll down on this page, you will find the help of the tool.
Comment: If things didn't work...
Did the Intersect tool error with a memory failure? Or is this step executing for a long time? Most likely a setting was missed when extracting the data from the UCSC Table Browser. Try again, double checking that:
For both SNP and EXON: “region” is actually changed to position with value chr22.
For EXON: “Create one BED record per”Coding Exons is selected (notWhole Gene as for the SNP data).
Carefully inspect the remaining Table Browser settings if these two most common reasons for problems were correct in your tool executions.
Let’s take a look at this dataset. The first six columns correspond to the exons, and the last six columns correspond to the SNPs. Column 4 contains the exon IDs, and column 10 contains the SNP IDs. In our screenshot you see that the first lines in the file all have the same exon ID but different SNP IDs, meaning these lines represent different SNPs that all overlap the same exon.
Question
For the first 3 exons in your file, what is the number of SNPs that fall into that exon?
At the time of writing, for hg38/GENCODE v29, joined with “Common dbSNPs(153)”, using ctrl+f (cmd+f on Mac OS) to look for how many times each is used:
Gene
Occurences
ENST00000252835.5_cds_0_0_chr22_15528159_f
2
ENST00000643195.1_cds_0_0_chr22_15528192_f
2
ENST00000343518.11_cds_0_0_chr22_15690078_f
4
Count the number of SNPs per exon
Since each line in our file represents a single overlap between SNP and exon, we can find the total number of SNPs in an exon, simply by counting the number of lines that have the same exon ID. However, to be more “proper” we will instead count the number of unique SNP IDs per exon. So let’s do this for all the exons in our file:
Hands On: Counting SNPs
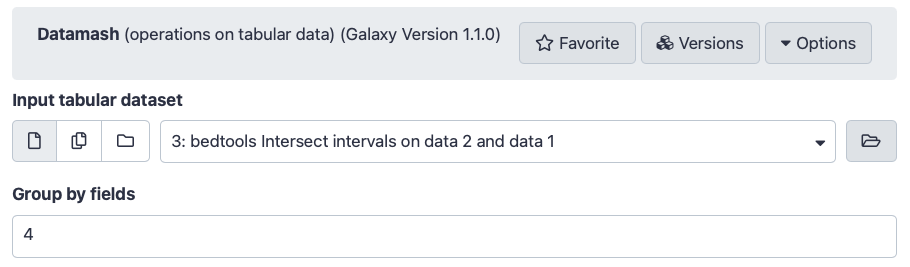
Datamash ( Galaxy version 1.8+galaxy0) (operations on tabular data):
“Input tabular dataset”: select the output dataset from bedtools intersect intervalstool
“Group by fields”: Column: 4 (the column with the exon IDs)
Scroll tool interface down to “Operation to perform on each group”
“Type”: Count Unique values
“On column”: Column: 10 (this column contains SNPs ids like rs2236639. This we will count occurrences of unique SNP ids for each exon)
Click Run Tool. Your new output dataset will look something like this:
This file contains only two columns. The first contains the exon IDs, and the second the number of times that exon ID appeared in the file - in other words, how many SNPs were present in that exon.
Question
How many exons are there in total in your file?
Each line now represents a different exon, so you can see the answer to this when you expand the history item, as in the image above. The exact number you see for your dataset may be slightly different due to the updates to the exon and SNPs information in UCSC. In our case the dataset contains 4,241 lines, which is equal to the number of exons overlapped by at least one SNP.
Sort the exons by SNPs count
Now that we have a list of all exons, and the number of SNPs they contain, we would like to know which exon has the highest number of SNPs. We can do this by sorting the file on the second column.
Hands On: Sorting
Sort ( Galaxy version 1.1.1) data in ascending or descending order:
“Sort Query”: Output from Datamashtool
In “Column selections” set the following:
“on column”: Column: 2
“in”: Descending order
“Flavor”: Fast numeric sort
Click Run Tool
Examine the output file.
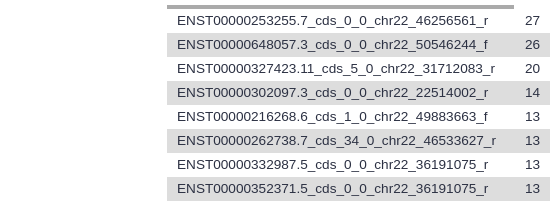
The file should look similar to before sorting, but now the exons with the highest number of SNPs are at the top.
Question
Which exon has the highest number of SNPs in your file?
When this tutorial was last updated, ENST00000253255.7_cds_0_0_chr22_46256561_r had 27 SNPs.
Keep in mind this may depend on your settings when getting the data from UCSC.
Select top five exons
Let’s say we want a list with just the top-5 exons with highest number of SNPs.
Hands On: Select first
Select first ( Galaxy version 9.5+galaxy0) lines from a dataset (head):
“File to select”: The output from Sorttool (previous step of the analysis)
“Operation”: Keep first lines
“Number of lines”: 5
Click Run Tool.
Examine the output file, this should contain only the first 5 lines of the previous dataset.
Recover exon info
Congratulations! You have now determined which exons on chromosome 22 have the highest number of SNPs, but what else can we learn about them? One way to learn more about a genetic location is to view it in a genome browser. However, in the process of getting our answer, we have lost information about the location of these exons on the chromosome. But fear not, Galaxy saves all of your data, so we can recover this information quite easily.
Hands On: Compare two Datasets
Compare two Datasets to find common or distinct rows:
“Compare”: Exons
“Using column”: Column: 4
“against”: the output from Select firsttool (previous step of the analysis)
“and column”: Column: 1
“to find”: Matching rows of 1st dataset
Click Run Tool
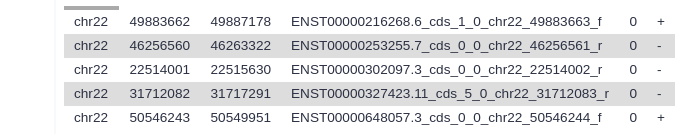
Examine your output file. It should contain the locations of your top 5 exons:
Display data in UCSC genome browser
A good way to learn about these exons is to look at their genomic surrounding. This can be done by using genome browsers. Galaxy can launch a genome browser such as IGV on your local machine, and it can connect to online genome browsers as well. An example of such an online genome browser is the UCSC genome browser.
Hands On: UCSC genome browser
First, check that the database of your latest history dataset is hg38. If not, click on the galaxy-pencil pencil icon and modify the Database/Build: field to Human Dec. 2013 (GRCh38/hg38) (hg38).
Click the desired dataset’s name to expand it.
Click on the “?” next to database indicator:
In the central panel, change the Database/Build field
Select your desired database key from the dropdown list: Human Dec. 2013 (GRCh38/hg38) (hg38)
Click the Save button
Second, check that the format of your latest history dataset is bed. If not, click on the galaxy-pencil pencil icon and modify the Datatype field to bed.
Click on the galaxy-pencilpencil icon for the dataset to edit its attributes
In the central panel, click galaxy-chart-select-dataDatatypes tab on the top
In the galaxy-chart-select-dataAssign Datatype, select bed from “New Type” dropdown
Tip: you can start typing the datatype into the field to filter the dropdown menu
Click the Save button
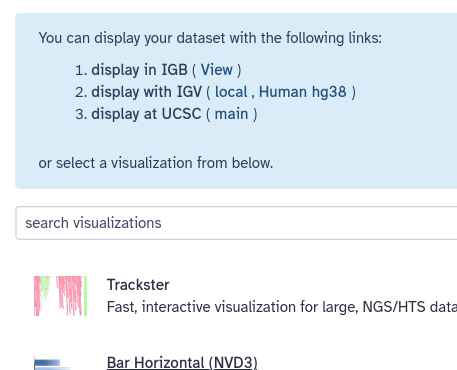
Click on the dataset in your history to expand it, then click on the galaxy-barchart (Visualize) icon
To visualize the data in UCSC genome browser, click on display at UCSC (main) now visible at the top (blue box) of the Visualize menu.
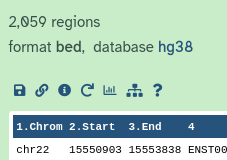
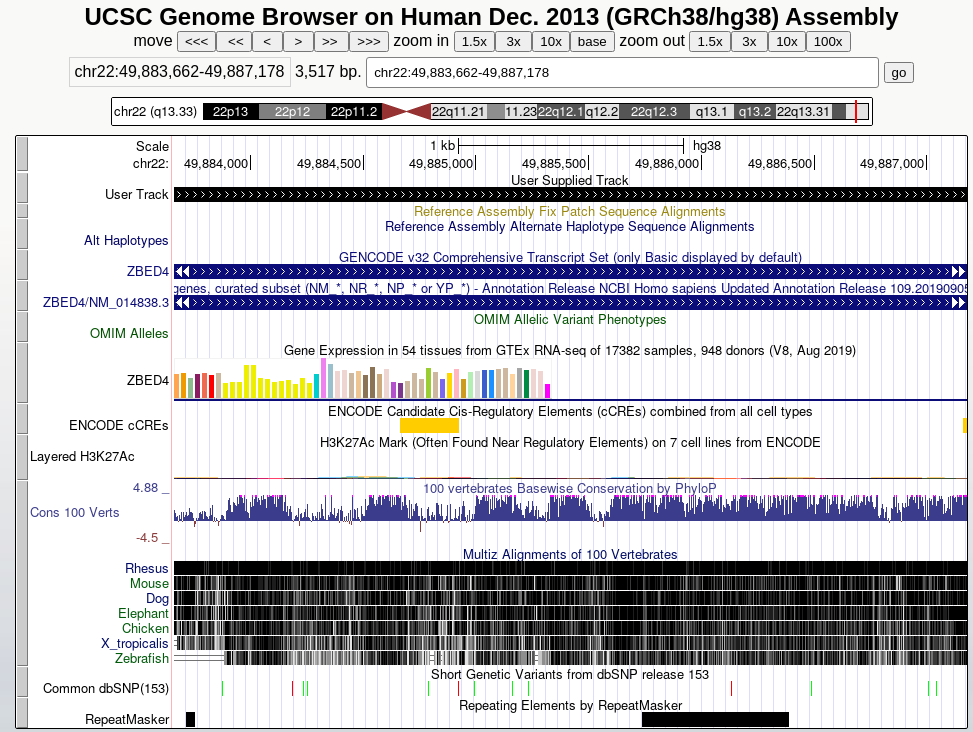
This will upload the data to UCSC as custom track. To see your data look at the User Track near the top. You can enter the coordinates of one of your exons at the top to jump to that location.
UCSC provides a large number of tracks that can help you get a sense of your genomic area, it contains common SNPs, repeats, genes, and much more (scroll down to find all possible tracks).
Histories and workflows: A brief introduction
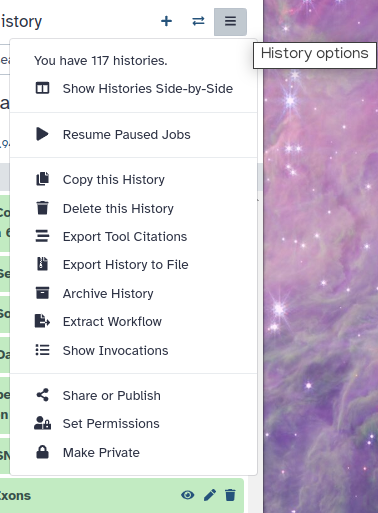
In Galaxy your analyses live in histories such as your current one. Histories can be very large, and you can have as many histories as you want. You can control your histories (switching, copying, sharing, creating a fresh history, etc.) in the galaxy-history-optionsHistory Options menu on the top of the history panel:
Figure 3: 'History options' allows for a variety of history operations
List your histories
You can create as many histories as you want. If you create a new history, your current history does not disappear. You can view your histories in two ways: (1) as a list or (2) side by side (also known as “Multiview”). Two Tip boxes below explain both of these approaches:
There are multiple ways in which you can view your histories:
Viewing histories using switch-histories “Switch to history” button. This is best for quickly switching between multiple histories.
Click the “Switch history” icon at the top of the history panel to bring up a list of all your histories:
Using the “Activity Bar”:
Click the “Show all histories” button within the Activity Bar on the left:
Using “Data” drop-down:
Click the “Data” link on the top bar of Galaxy interface and select “Histories”:
Using the Multi-view, which is best for moving datasets between histories:
Click the galaxy-history-options menu, and select galaxy-multihistoryShow histories side-by-side
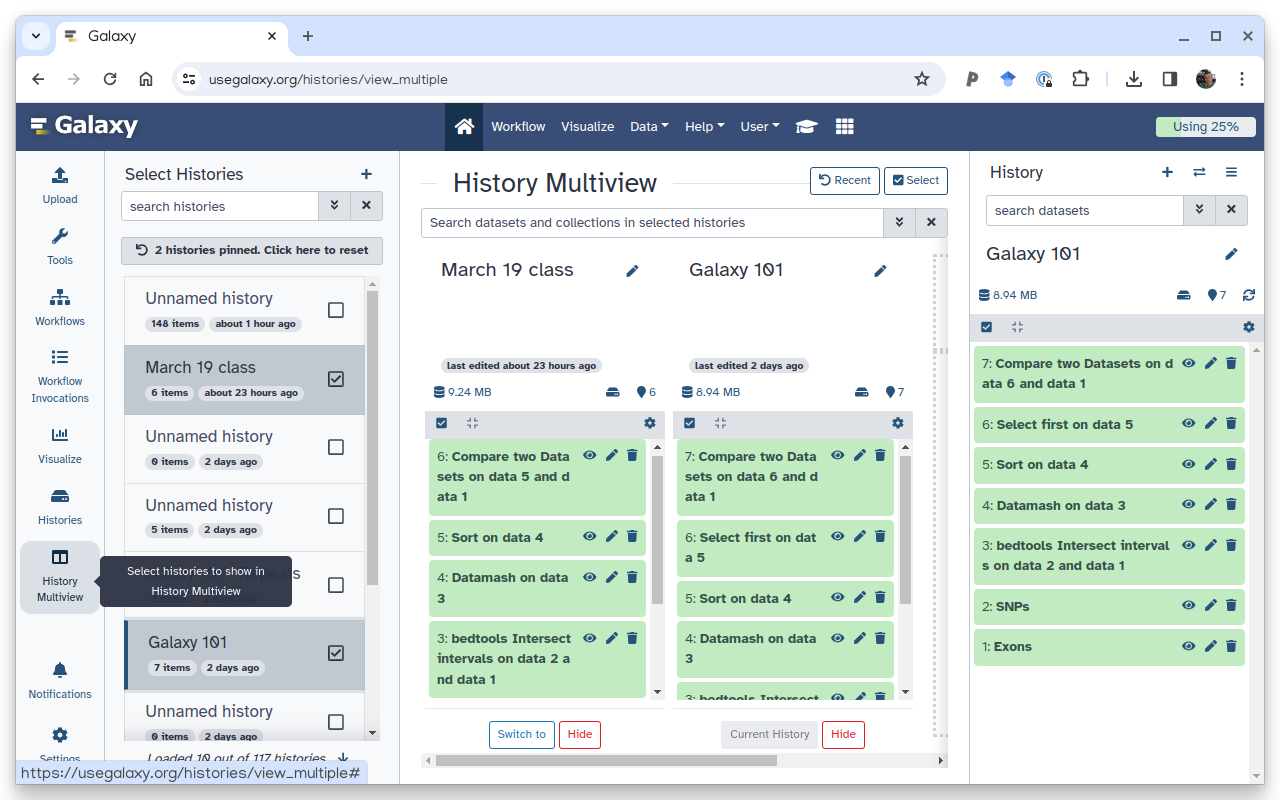
You can view multiple Galaxy histories at once. This allows to better understand your analyses and also makes it possible to drag datasets between histories. This is called “History multiview”. The multiview can be enabled either view History menu or via the Activity Bar:
Option 1: Enabling Multiview via History menu is done by first clicking on the galaxy-history-options “History options” drop-down and selecting galaxy-multihistory “Show Histories Side-by-Side option”:
Option 2: Clicking the galaxy-multihistory “History Multiview” button within the Activity Bar:
Figure 4: Histories side-by-side view: in this view you drag datasets between histories, switch between histories, create new histories etc.
You can always return to your analysis view by clicking on Galaxy Icon in the top menu bar.
Convert your analysis history into a workflow
When you look carefully at your history, you can see that it contains all the steps of our analysis, from the beginning to the end. By building this history we have actually built a complete record of our analysis with Galaxy preserving all parameter settings applied at every step. But when you receive new data, or a new report is requested, it would be tedious to do each step over again. Wouldn’t it be nice to just convert this history into a workflow that we will be able to execute again and again?
Galaxy makes this very easy with the Extract workflow option. This means any time you want to build a workflow, you can just perform the steps once manually, and then convert it to a workflow, so that next time it will be a lot less work to do the same analysis.
Hands On: Extract workflow
Clean up your history: remove any failed (red) jobs from your history by clicking on the galaxy-delete button.
This will make the creation of the workflow easier.
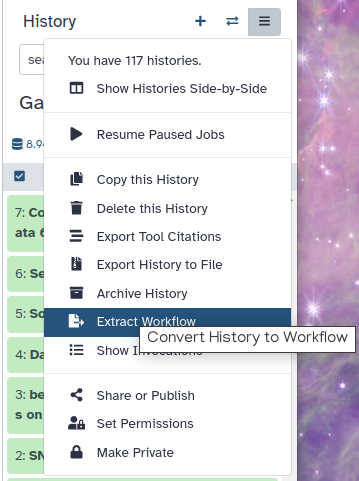
Click on “History options” dropdown at the top of your history panel and select Extract workflow.
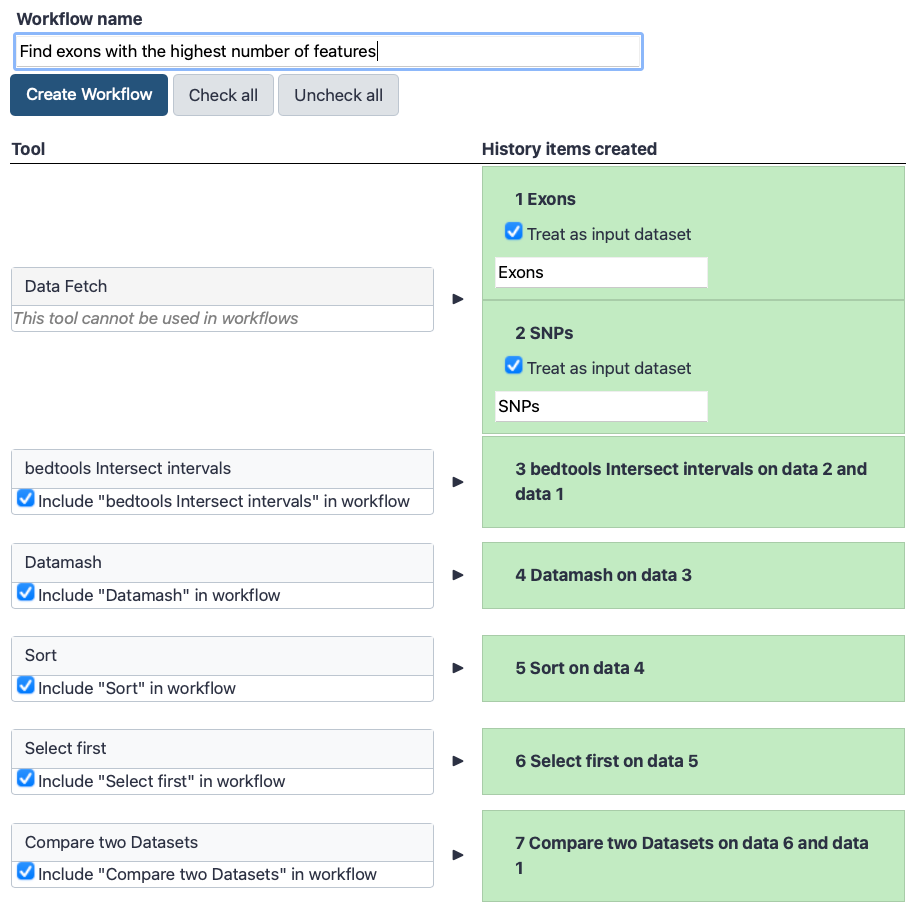
The central panel will show the content of the history in reverse order (oldest on top), and you will be able to choose which steps to include in the workflow.
Replace the Workflow name to something more descriptive, for example Find exons with the highest number of features.
While we created this workflow initially to analyse SNPs, if we had similarly formatted datasets we could use this workflow to find different features.
If there are any steps that shouldn’t be included in the workflow, you can uncheck them in the first column of boxes.
Click on the Create Workflow button near the top.
You will get a message that the workflow was created. But where did it go?
Click on Workflows in the left menu of Galaxy (Activity Bar). Here you have a list of all your workflows. Your newly created workflow should be listed at the top:
Figure 5: Workflow are listed in the center pane of the Galaxy interface as cards.
The workflow editor
We can examine the workflow in Galaxy’s workflow editor. Here you can view/change the parameter settings of each step, add and remove tools, and connect an output from one tool to the input of another, all in an easy and graphical manner. You can also use this editor to build workflows from scratch.
Hands On: Extract workflow
Click on the triangle to the right of your workflow name.
Figure 7: Workflow editor interface. It can be used for creation and editing of workflows of any complexity.
When you click on a workflow step, you will get a view of all the parameter settings for that tool on the right-hand side of your screen.
Re-arrange the boxes so you can clearly see the data flow. The default automatic layout hides some of the connections due to overlapping and box placement.
Make sure the check boxes for out_file1 in the Select First and Compare two Datasets tools are selected. Make sure that everything else is not selected.
Now, when we run the workflow, we will only see the final two outputs, i.e. the table with the top-5 exons and their SNP counts, and the file with exons ready for viewing in a genome browser.
The box named Exons is named ok, but we want to change SNPs since this workflow is not specific to SNPs
Click on the box corresponding to the SNPs input dataset
change the Label to Features on the right-hand side of your screen.
Let’s also rename the outputs:
Click on the Select first tool in the workflow editor
In the menu on the right click on Configure Output: 'out_file1'
Under Rename dataset, and enter a descriptive name for the output dataset like Top 5 exon IDs
Figure 8: The datasets generated by the workflow execution can be automatically renamed using the 'Rename dataset' option
Repeat this for the output of the Compare two Datasets tool, naming it Top 5 exons
Save your workflow (important!) by clicking on the galaxy-save icon at the top right of the screen.
Return to the analysis view by clicking on the Galaxy Icon at the top left of the menu bar.
Comment
We could validate our newly built workflow by running it on the same input datasets that we used at the start of this tutorial, in order to make sure we do obtain the same results.
Run workflow on different data
Now that we have built our workflow, let’s use it on some different data. For example, let’s find out which exons have the highest number of repeat elements.
Hands On: Run workflow
Create a new history and give it a name.
To create a new history simply click the new-history icon at the top of the history panel:
We will need the list of exons again. We don’t have to get this from UCSC again, we can just copy it from our previous history. To do this:
Bring up a list of all you histories:
There are multiple ways in which you can view your histories:
Viewing histories using switch-histories “Switch to history” button. This is best for quickly switching between multiple histories.
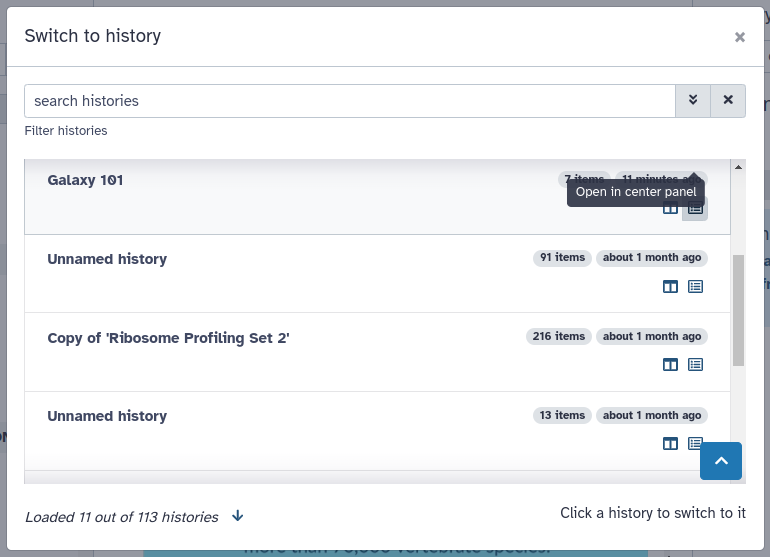
Click the “Switch history” icon at the top of the history panel to bring up a list of all your histories:
Using the “Activity Bar”:
Click the “Show all histories” button within the Activity Bar on the left:
Using “Data” drop-down:
Click the “Data” link on the top bar of Galaxy interface and select “Histories”:
Using the Multi-view, which is best for moving datasets between histories:
Click the galaxy-history-options menu, and select galaxy-multihistoryShow histories side-by-side
Display the “Galaxy 101” history in the Center pane by clicking “Open in Center pane” button:
Drag and drop Exons dataset into the empty history created at step 1
Click on Galaxy at the left to return to the main analysis window
Click galaxy-uploadUpload at the top of the activity panel
Select galaxy-wf-editPaste/Fetch Data
Paste the link(s) into the text field
Press Start
Close the window
Again, for reproducibility we obtain the data from Zenodo ensuring that the results will never change, allowing us to do good science! However if you wish to obtain UCSC data:
Hands On: Obtaining Exons from UCSC
UCSC Maintool table browser:
In the tool menu, navigate to Get Data -> UCSC Main - table browser
Now set the following parameters:
“clade”: Mammal
“genome”: Human
“assembly”: Dec. 2013 (GRCh38/hg38)
“group”: Repeats
param-text“region” should be changed to position with value chr22
“output format” should be changed to BED - browser extensible data
param-check“Send output to” should have the option Galaxy checked
Click on get output and then Send query to Galaxy on the next screen.
Renamegalaxy-pencil the dataset to Repeats
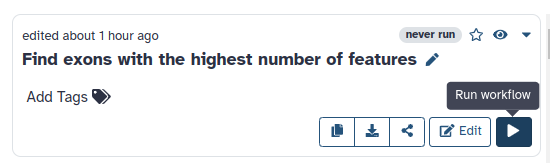
Open the workflow menu (top menu bar). Find the workflow you made in the previous section, and select the option Run.
Click on Workflows on the Activity Bar on the left.
At the top of the resulting page you will have the option to switch between the My workflows, Workflows shared with me and Public workflows tabs.
Select the tab you want to see all workflows in that category
Search for your desired workflow.
Click on the workflow name: a pop-up window opens with a preview of the workflow.
To run it directly: click Run (top-right).
Recommended: click Import (left of Run) to make your own local copy under Workflows / My Workflows.
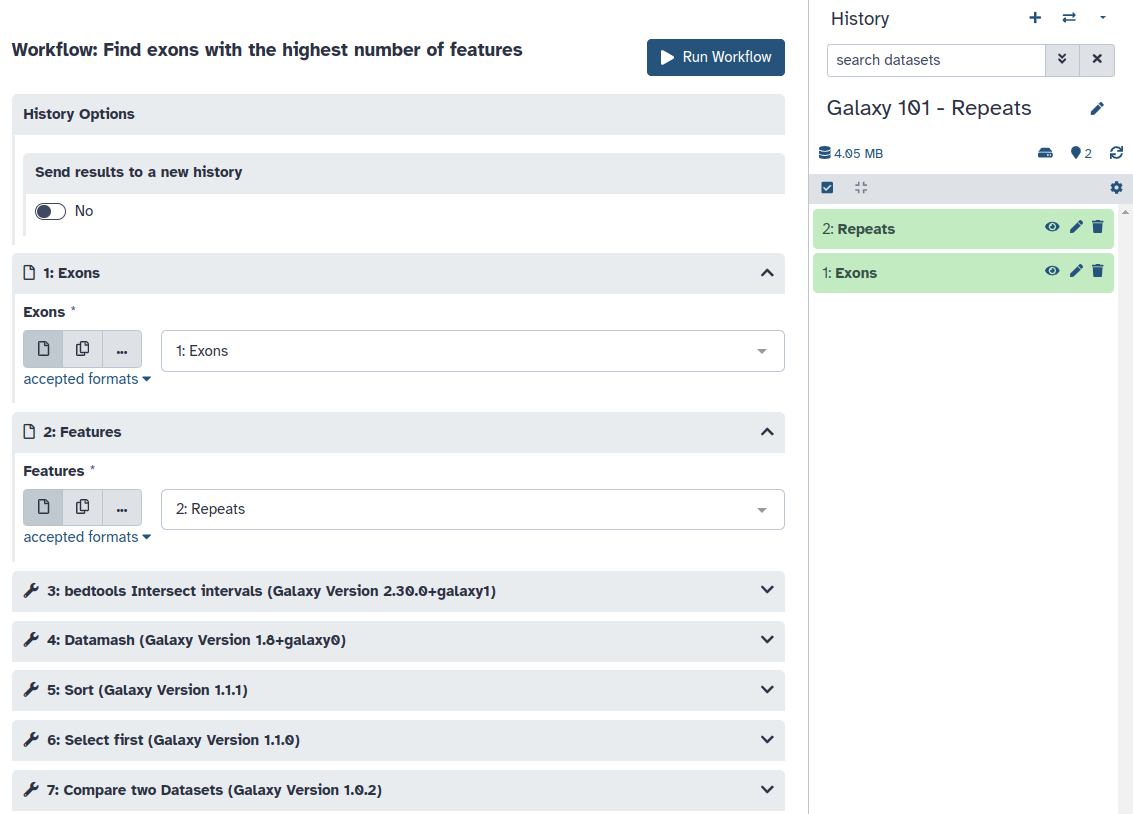
The central panel will change to allow you to configure and launch the workflow.
Select appropriate datasets for the inputs as shown below, then scroll down and click Run workflow.
Select Expand to full workflow form
param-file“Exons”: the Exons file you copied from our previous history
param-file“Features”: the Repeats file we downloaded from UCSC
Comment: Potential workflow issues
Galaxy validates the workflow inputs to ensure they’re correct. It may show a validation error at the start, until you select Exons for the Exons input, and your repeats for the Features input.
If you see an “Invalid column choice” error, you need to specify which column you want to use. If you have to type the column number, you need to type just the number e.g. 4 (not Column 4 or anything else).
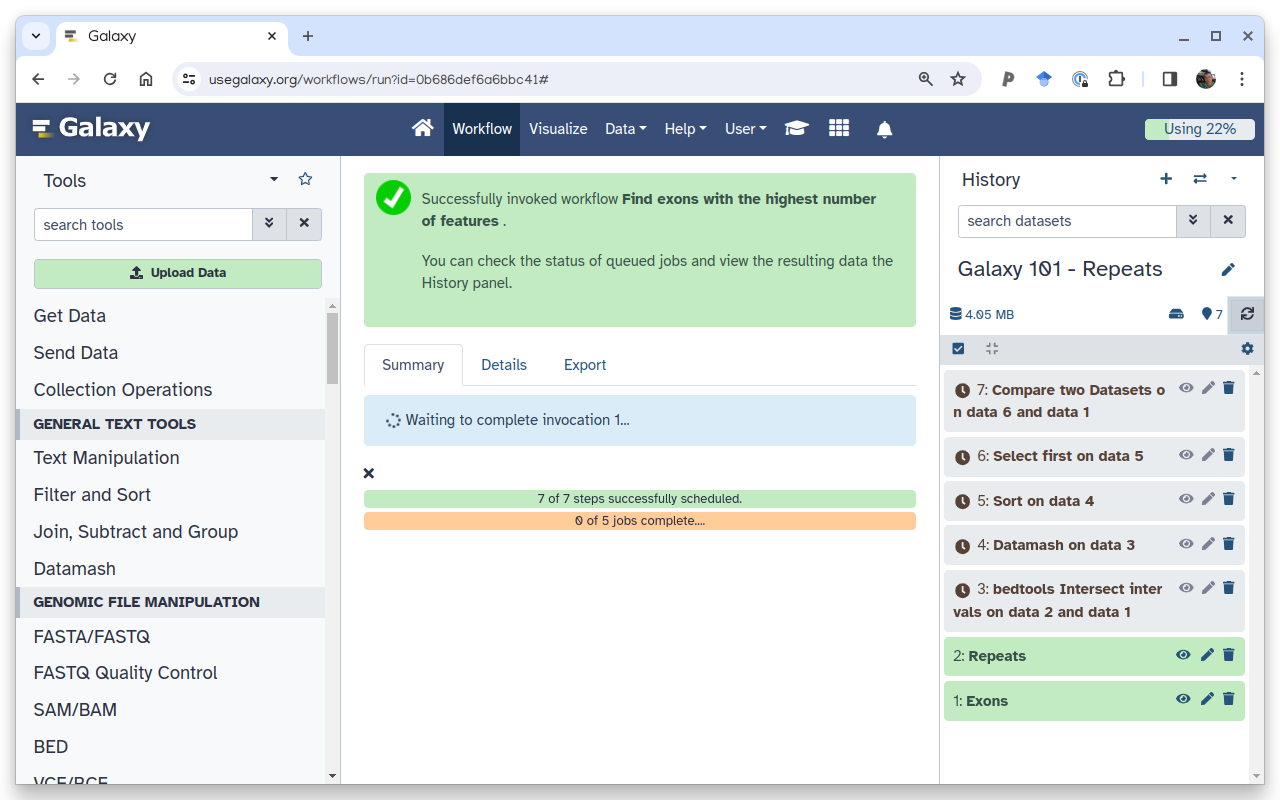
Once the workflow has started, you will initially be able to see all its steps, but the unimportant intermediates may disappear after they complete successfully (based on the workflow settings):
Comment: Unhiding hidden datasets
Because most intermediate steps of the workflow could be hidden, once it is finished you may only see the final two datasets. If we want to view the intermediate files after all, you can click the “## hidden” just below the history’s name.
Question
Which exon had the highest number of repeats? How many repeats were there?
Share your work
One of the most important features of Galaxy comes at the end of an analysis. When you have published striking findings, it is important that other researchers are able to reproduce your in-silico experiment. Galaxy enables users to easily share their workflows and histories with others.
Sharing your history allows others to import and access the datasets, parameters, and steps of your history.
Access the history sharing menu via the History Options dropdown (galaxy-history-options), and clicking “history-share Share or Publish”
Share via link
Open the History Optionsgalaxy-history-options menu at the top of your history panel and select “history-share Share or Publish”
galaxy-toggleMake History accessible
A Share Link will appear that you give to others
Anybody who has this link can view and copy your history
Publish your history
galaxy-toggleMake History publicly available in Published Histories
Anybody on this Galaxy server will see your history listed under the Published Histories tab opened via the galaxy-histories-activityHistories activity
Share only with another user.
Enter an email address for the user you want to share with in the Please specify user email input below Share History with Individual Users
Your history will be shared only with this user.
Finding histories others have shared with me
Click on the galaxy-histories-activityHistories activity in the activity bar on the left
Click the Shared with me tab
Here you will see all the histories others have shared with you directly
Note: If you want to make changes to your history without affecting the shared version, make a copy by going to History Optionsgalaxy-history-options icon in your history and clicking Copy this History
Hands On: Share history and workflow
Share one of your histories with your neighbour.
See if you can do the same with your workflow!
Find the history and/or workflow shared by your neighbour. Histories shared with specific users can be accessed by those users in their galaxy-gear history menu under Histories shared with me.
Conclusion
trophy Well done! You have just performed your first analysis in Galaxy. You also created a workflow from your analysis so you can easily repeat the exact same analysis on other datasets. Additionally you shared your results and methods with others.
You've Finished the Tutorial
Please also consider filling out the Feedback Form as well!
Key points
Galaxy provides an easy-to-use graphical user interface for often complex command-line tools
Galaxy keeps a full record of your analysis in a history
Workflows enable you to repeat your analysis on different data
Galaxy can connect to external sources for data import and visualization purposes
Galaxy provides ways to share your results and methods with others
Frequently Asked Questions
Have questions about this tutorial? Have a look at the available FAQ pages and support channels
Did you use this material as an instructor? Feel free to give us feedback on how it went.
Did you use this material as a learner or student? Click the form below to leave feedback.
Hiltemann, Saskia, Rasche, Helena et al., 2023 Galaxy Training: A Powerful Framework for Teaching! PLOS Computational Biology 10.1371/journal.pcbi.1010752
Batut et al., 2018 Community-Driven Data Analysis Training for Biology Cell Systems 10.1016/j.cels.2018.05.012
@misc{introduction-galaxy-intro-101,
author = "Saskia Hiltemann and Nicola Soranzo and Clemens Blank and Anton Nekrutenko and Björn Grüning and Anne Pajon and Helena Rasche",
	title = "Galaxy Basics for genomics (Galaxy Training Materials)",
	year = "",
	month = "",
	day = "",
	url = "\url{https://training.galaxyproject.org/training-material/topics/introduction/tutorials/galaxy-intro-101/tutorial.html}",
	note = "[Online; accessed TODAY]"
}
@article{Hiltemann_2023,
	doi = {10.1371/journal.pcbi.1010752},
	url = {https://doi.org/10.1371%2Fjournal.pcbi.1010752},
	year = 2023,
	month = {jan},
	publisher = {Public Library of Science ({PLoS})},
	volume = {19},
	number = {1},
	pages = {e1010752},
	author = {Saskia Hiltemann and Helena Rasche and Simon Gladman and Hans-Rudolf Hotz and Delphine Larivi{\`{e}}re and Daniel Blankenberg and Pratik D. Jagtap and Thomas Wollmann and Anthony Bretaudeau and Nadia Gou{\'{e}} and Timothy J. Griffin and Coline Royaux and Yvan Le Bras and Subina Mehta and Anna Syme and Frederik Coppens and Bert Droesbeke and Nicola Soranzo and Wendi Bacon and Fotis Psomopoulos and Crist{\'{o}}bal Gallardo-Alba and John Davis and Melanie Christine Föll and Matthias Fahrner and Maria A. Doyle and Beatriz Serrano-Solano and Anne Claire Fouilloux and Peter van Heusden and Wolfgang Maier and Dave Clements and Florian Heyl and Björn Grüning and B{\'{e}}r{\'{e}}nice Batut and},
	editor = {Francis Ouellette},
	title = {Galaxy Training: A powerful framework for teaching!},
	journal = {PLoS Comput Biol}
}
Funding
These individuals or organisations provided funding support for the development of this resource
5 stars:
Liked: all of the tutorial
Disliked: I could not find the activity bar , I think this Galaxy version is modified
5 stars:
Liked: it was clear and simple for begginers
5 stars:
Liked: Step by step images, easy to follow
5 stars:
Liked: The written instructions and screenshots were very clear, and aligned well with the interface. The extra tips were also very helpful for double-checking I was doing everything correctly.
Disliked: I have no suggestions for improving this tutorial. I found the instructions very user-friendly and clear.
June 2026
5 stars:
Liked: It is user-friendly. You connect the previous training easily by dropping down the Tip Boxes.
Disliked: Suggestion 1. Make it easier when switching among Histories and Workflow. Suggestion 2. The deleted histories are still there after removing it from the History Panel.
5 stars:
Liked: all
Disliked: n/a
3 stars:
Liked: The fact that I am now starting to process a type of biological data.
Disliked: The workflow of the instruction is somewhat lacking; there are no pictures on some instructions provided. There are also updates on the tools being used in this tutorial.
5 stars:
Liked: How easy it was to follow. Also, tools gave examples for use with datasets
5 stars:
Liked: The ease with which the analysis protocols mesh and facilitate access to the UCSC genomics server
Disliked: This was/is a more or less trivial exercise that did not push any limits. It works very well.
May 2026
4 stars:
Liked: The tips
5 stars:
Liked: It was easy for a beginner.
Disliked: Not sure.
5 stars:
Liked: I liked the clarity and detailed explanations of this tutorial. Step-by-step guidance made concepts easy to understand.
5 stars:
Liked: practical
Disliked: n/a
4 stars:
Liked: Easy to follow
Disliked: More explanation on parameters of the tools
5 stars:
Liked: The simplicity and clarity of the instructions
Disliked: I would like the tutorial to include a section explaining the tools and configurations to help me better understand what I'm working with.
5 stars:
Liked: Easy to follow the stpes
5 stars:
Liked: The step by step guide was useful
Disliked: more interactive questions, we actually submit our answers and get responses if successful
5 stars:
Liked: usefull
Disliked: its ok
5 stars:
Liked: I liked that a video was also recorded. It made it easier to follow the tutorial
Disliked: It's perfect
5 stars:
Liked: Clear and fast way to learn about Galaxy's tools
4 stars:
Liked: the context of the analysis is given
Disliked: I sometimes confused about how to get back to the main menu/home after doing the steps in analysis.
5 stars:
Liked: The use of workflow generated for one feature to a different features and sharing of history for others as per our needs
Disliked: I have a small UI suggestion for the workflow editor: Currently, it is a bit difficult to visually follow the direction of the steps just by looking at the boxes and connection lines. Adding clearer arrows or directional symbols to show the data flow between boxes would make workflow editing much easier Coming from an academic publishing background, two critical points that many researchers will face are: 1. Repository Export: How to transition from a Galaxy history to an official data repository (like Zenodo or RDM) to get a formal DOI for journal submissions. 2. Data Retention Visibility: Clear guidelines in the tutorials explaining how long data is stored on different UseGalaxy servers (USA, EU, AU, FR) vs. temporary scratch space, and why a shared link isn't a permanent substitute for a journal DOI. Adding a short "Publishing and Data Sustainability" box at the end of the workflows would be incredibly helpful for researchers preparing their data for peer-reviewed journals. Thank you again for the amazing work!
5 stars:
Liked: Having made different histories, again by reusing the uploaded data or getting the same data from diverse sources, and selecting one of the workflows I saved earlier
5 stars:
Liked: it was a quick and easy tutorial showing off the power of galaxy
5 stars:
Liked: Very accessible and easy to follow!
5 stars:
Liked: I liked the clear organization of the tutorial and the step-by-step practical workflow. The hands-on exercises for locating exons, counting SNPs, sorting results, and creating workflows were very useful and easy to follow. The tutorial made Galaxy more understandable for beginners and showed how bioinformatics analysis can be performed without advanced programming skills. I also appreciated the integration with the UCSC Genome Browser and the explanation of histories and workflows.
Disliked: Some sections could include more detailed explanations for beginners, especially when introducing biological concepts such as SNPs and exon analysis. Adding short video demonstrations or screenshots for complex steps would make the tutorial even easier to follow. It would also be helpful to include additional real-world datasets and a final summary diagram showing the complete workflow from data input to analysis results.
3 stars:
Liked: The fact that there are tips and you can go on with or without a tutor or assistance
Disliked: if possible a video
5 stars:
Disliked: I am happy for getting this training
4 stars:
Liked: Easy to learn
Disliked: Easy to learn but not easy for someone who don't use Galaxy
4 stars:
Liked: Step-by-step instruction
Disliked: If the training window can be enlarged, it would be great. It is still working fine at the moment. Thanks!
4 stars:
Liked: step by step, well writen with screen capture
5 stars:
Liked: The instructions were very comprehensive and clear.
Disliked: Minor corrections in grammar. There are some confusing/unremoved words in some sentences.
5 stars:
Liked: The workflow has been explained in easy way and all steps working properly.
5 stars:
Liked: Very clear explanations, easy to follow
5 stars:
Liked: I found it very user-friendly
4 stars:
Liked: I like the graphical workflow, it was easy to understand.
Disliked: Adding more small video clips is much better for understanding well.
5 stars:
Liked: I liked the details provided in the hands-on tutorial, as well as the images provided throughout. This made the tutorial relatively easy to follow as a first time Galaxy user.
Disliked: I think more step-by-step pictures could be added to the workflow section of the tutorial to make it easier for first time Galaxy users.
5 stars:
Liked: very clear and precise instructions
5 stars:
Liked: It was very clear and easy to follow
Disliked: It was very clear to be honest
5 stars:
Liked: the topic
Disliked: n/a
5 stars:
Liked: I liked it. I was easy to follow for an beginner.
Disliked: I am not sure.
5 stars:
Liked: I liked that the indroduction was easy to follow for a beginner. I have never used Galaxy before and the tutorial was easy to follow.
Disliked: I am not sure. I did not encounter any problems and enjoyed the learning.
4 stars:
Liked: Sequential order of what should be done
Disliked: The thing is, there are many specifications in every tool. But as a beginner who wants to learn a lot related to bioinformatics, I need to know what each specification is for. Why do we need to choose those specifications? There was information on what should be done, but there wasn't much information on why we are doing that. So, it will be really useful if you upload tutorials with detailed information. on the specifications.
4 stars:
Liked: I was able to carry out almost all steps by just following the guidelines without asking anyone, nor AI, for help.
Disliked: Maybe next time make pointing allows for most crucial steps like the second last step of running the workflow.
5 stars:
Liked: I like run different data
Disliked: n/A
5 stars:
Liked: I like the part in analysis part, where how to analysis the data
4 stars:
Liked: Clear instructions, easy to follow
Disliked: The final step was a bit confusing (visualizing SNPs in genome browser), but I think that's more to do with the genome browser than with this tutorial, to be fair. I can't really think of anything in particular that needs improving.
4 stars:
Liked: step by step tutorial
Disliked: some of the features of the tools are not available due to upgrading of the tools or version i think.
4 stars:
Liked: Extraction of workflow and history sharing
Disliked: Brief introduction of the tools. For a complete beginner, jumping straight to performing analysis without knowing which tools are available or what they are used for, is a bit jarring.
3 stars:
Liked: the clear steps
Disliked: the time it takes for the analysis to run, images bigger/clearer fonts
4 stars:
Liked: Very easy to follow
5 stars:
Liked: Easy-to-follow Video tutorial
March 2026
5 stars:
Liked: Easy instructions to follow along, instant results
Disliked: When I did it, an extra step appeared, which I am unsure if this is due to a mistake on my end (probably), or due to updated versions of certain tools, so maybe a 2026 version? But very good tutorial!
February 2026
5 stars:
Liked: very hands-on
Disliked: When I first opened my workflow, to create and save, it had an additional step in position 3 named Convert... This was not one of the steps I had explicitly performed so I was wondering why that was there and if i should remove it since no data seemed to be entering or exiting there. I removed it and the workflow works fine.. Is this normal or is this a bug?
5 stars:
Liked: All the steps were explained so clearly that there was no chance of making mistakes. Thank you! The tutorial was amazing.
January 2026
5 stars:
Liked: I like the ability to fine-tune each utility.
October 2025
5 stars:
Liked: Well structured, attention to detail.
Disliked: No suggestions
4 stars:
Liked: simplified
5 stars:
Liked: Explain elaborately and beginer friendly.
Disliked: UCSC visualization part
September 2025
5 stars:
Liked: All the guidelines were very supportive.
Disliked: Nothing that much.
5 stars:
Liked: easy to understand, well organized
August 2025
5 stars:
Liked: Yes, but I want to learn more!
Disliked: Add introductory videos
Questions:
Open image in new tab

 Open image in new tab


 Open image in new tab


 Open image in new tab
Open image in new tab
Open image in new tab
Open image in new tab
Open image in new tab


