Genome Assembly Quality Control
| Author(s) |
|
| Reviewers |
|
OverviewQuestions:
Objectives:
Is my genome assembly ready for annotation and/or scaffolding?
Requirements:
Assess assembly quality
Time estimation: 2 hoursLevel: Intermediate IntermediateSupporting Materials:Published: Aug 26, 2022Last modification: Jun 4, 2025License: Tutorial Content is licensed under Creative Commons Attribution 4.0 International License. The GTN Framework is licensed under MITpurl PURL: https://gxy.io/GTN:T00028rating Rating: 4.3 (0 recent ratings, 3 all time)version Revision: 6
In this tutorial, we will assess the assembly quality of 2 assemblies generated with Hifiasm and Flye using PacBio HiFi reads of a species of fungi, Saccharomyces cerevisiae INSC1019 and compare the results with the actual reference genome Saccharomyces cerevisiae S288C.
AgendaIn this tutorial, we will cover:
Get data
We will use long quality reads sequencing data from PacBio HiFi sequencing of Saccharomyces cerevisiae INSC1019 genome. This data is a subset of data from ENA repository SRR13577847. We will also use the reference genome assembly downloaded from the NCBI website and we will use it as a comparison with our own assemblies.
Get data from Zenodo
Hands On: Data upload from Zenodo
- Create a new history for this tutorial
Import the files from Zenodo
https://zenodo.org/record/6947782/files/GCA_000146045.2_genomic.fna
https://zenodo.org/record/6947782/files/Scerevisiae-INSC1019.flye.30x.fa
https://zenodo.org/record/6947782/files/Scerevisiae-INSC1019.hifiasm.30x.fa
https://zenodo.org/record/6947782/files/SRR13577847_subreads.30x.fastq.gz
- Copy the link location
Click galaxy-upload Upload at the top of the activity panel
- Select galaxy-wf-edit Paste/Fetch Data
Paste the link(s) into the text field
Press Start
- Close the window
Check that the datatype is
fastqsanger.gzforSRR13577847_subreads.30x.fastq.gz
- Click on the galaxy-pencil pencil icon for the dataset to edit its attributes
- In the central panel, click galaxy-chart-select-data Datatypes tab on the top
- In the galaxy-chart-select-data Assign Datatype, select
datatypesfrom “New Type” dropdown
- Tip: you can start typing the datatype into the field to filter the dropdown menu
- Click the Save button

Evaluation of assembly contiguity and correctness with Quast
A way to calculate metrics assembly is to use QUAST = QUality ASsessment Tool. Quast is a tool to evaluate genome assemblies by computing various metrics and to compare genome assembly with a reference genome. The manual of Quast is here: Quast
Comment: QUAST statisticsQUAST will provide us with the following statistics:
- Contigs: The total number of contigs in the assembly.
- Largest contig: The length of the largest contig in the assembly.
- Total length: The total number of bases in the assembly.
- Nx: The largest contig length, L, such that contigs of length >= L account for at least x% of the bases of the assembly.
- NGx: The contig length such that using equal or longer length contigs produces x% of the length of the reference genome, rather than x% of the assembly length.
- GC content: the percentage of nitrogenous bases which are either guanine or cytosine.
If a reference genome is provided, the report also indicates:
- Genome fraction (%): total number of aligned bases in the reference genome, divided by the genome size
- Duplication ratio: total number of aligned bases in the assembly, divided by the total number of aligned bases in the reference genome
- NGA50: NG50 where the lengths of aligned blocks are counted instead of contig lengths. i.e., if a contig has a misassembly with respect to the reference, the contig is broken into smaller pieces. This metric is computed only if a reference genome is provided. LGA50: LG50 where aligned blocks are counted instead of contigs. i.e., if a contig has a misassembly with respect to the reference, the contig is broken into smaller pieces
Many other metrics are available when clicking on
Extended report!
Hands On: assembly evaluation with Quast
- Quast ( Galaxy version 5.2.0+galaxy0) with the following parameters:
- “Use customized names for the input files?”:
No, use datasets names- param-files “Contigs/scaffolds file”:
Scerevisiae-INSC1019.flye.30x.faandScerevisiae-INSC1019.hifiasm.30x.fa- “Reads options”:
Pacbio SMRT reads
- param-file “FASTQ file”:
SRR13577847_subreads.30x.fastq.gz- “Type of assembly”:
Genome
- “Use a reference genome?”:
Yes
- param-file “Reference genome”:
GCA_000146045.2_genomic.fna- “Is genome large (>100Mpb)?”:
No
QuestionWith the informations generated by Quast, compare the two assemblies to the reference genome
- Which assembly is closest to the reference genome?
- What is the longest contig of the Flye and Hifiasm assemblies?
- What is the N50 of the Flye assembly?
- Which percentage of reads mapped to each assembly?
- The Flye assembly, with a genome fraction of 99.57% while Hifiasm have a low genome fraction (75.15%) which can indicate a problematic assembly.
- The longest contig is 1,438,238 bp for Flye assembly while is 1,795,653 bp for Hifiasm
- The N50 of the Flye assembly is 929,061 bp.
- A total of 99.96% of reads mapped were mapped to the Flye assembly while only 91.02% against the Hifiasm assembly.
Without a reference genome, it would have been harder to determine that assembly with Hifiasm is problematic. Metrics on the assembly itself are not always sufficient and therefore it is necessary to use other methodologies to ensure the quality of an assembly.
Evaluation of assembly completness
Core genes completness with BUSCO
BUSCO (Benchmarking Universal Single-Copy Orthologs) allows a measure for quantitative assessment of genome assembly based on evolutionarily informed expectations of gene content. Details for this tool are here: Busco website
Hands On: assessing assembly completness with BUSCO
- Busco ( Galaxy version 5.3.2+galaxy0) with the following parameters:
- param-files “Sequences to analyse”:
Scerevisiae-INSC1019.flye.30x.fa,Scerevisiae-INSC1019.hifiasm.30x.faandGCA_000146045.2_genomic.fna- “Mode”:
Genome assemblies (DNA)
- “Use Augustus instead of Metaeuk”:
Use Metaeuk- “Auto-detect or select lineage?”:
Select lineage
- “Lineage”:
Saccharomycetes- “Which outputs should be generated”:
short summary textandsummary image
QuestionCompare the number of BUSCO genes identified in the Flye and Hifiasm assembly to the reference genome. What do you observe ?
Short summary generated by BUSCO indicates that reference genome contains:
- 2129 Complete BUSCOs (of which 2128 are single-copy and 49 are duplicated),
- 2 fragmented BUSCOs,
- 6 missing BUSCOs.
Short summary generated by BUSCO indicates that Flye assembly contains:
- 2127 complete BUSCOs (2127 single-copy and 49 duplicated),
- 2 fragmented BUSCOs
- 8 missing BUSCOs.
Short summary generated by BUSCO indicates that Hifiasm assembly contains:
- 1663 complete BUSCOs (1662 single-copy and 27 duplicated),
- 5 fragmented BUSCOs
- 469 missing BUSCOs.
BUSCO analysis confirms that Flye assembly is better than Hifiasm assembly. Flye is also similar in completness to the reference genome with similar number of complete, fragmented and missing BUSCOs genes.
Despite BUSCO being robust for species that have been widely studied, it can be inaccurate when the newly assembled genome belongs to a taxonomic group that is not well represented in OrthoDB. Even in a well-represented taxonomic group, the bias on the selection of reference genomes selected to create OrthoDB can lead to an under-scoring of the newly assembled genome and is dependent on the evolution of the genomes. For example, in microsporidia, basal genomes have much lower scores due to the strong drive on gene loss and gain in these organisms.
k-mer based assembly evaluation with Merqury
Meryl will allow us to generate the k-mer profile by decomposing the sequencing data into k-length substrings, counting the occurrence of each k-mer and determining its frequency. Meryl comprises three main modules: one for generating k-mer databases, one for filtering and combining databases, and one for searching databases.
Hands On: Generate k-mers count distribution
- Meryl ( Galaxy version 1.3+galaxy6) with the following parameters:
- “Operation type selector”:
Count operations
- “Count operations”:
Count: count the ocurrences of canonical k-mers- param-file “Input sequences”:
SRR13577847_subreads.30x.fastq.gz- “K-mer size selector”:
Estimate the best k-mer size
- “Genome size”:
12000000
Merqury is used for reference-free assembly evaluation based on k-mer set operations. By comparing k-mers in a de novo assembly to those found in unassembled high-accuracy reads, Merqury estimates base-level accuracy and completeness. For trios, Merqury can also evaluate haplotype-specific accuracy, completeness, phase block continuity, and switch errors. Multiple visualizations and tables, such as k-mer spectrum plots, are generated for evaluation of the assembly quality.
Hands On: K-mer based evaluation with Merqury
- Merqury ( Galaxy version 1.3+galaxy2) with the following parameters:
- “Evaluation mode”:
Default mode
- param-file “K-mer counts database”:
Meryldb(output of Meryl tool)- “Number of assemblies”:
One assembly
- param-files “Genome assembly”:
Scerevisiae-INSC1019.flye.30x.fa,Scerevisiae-INSC1019.hifiasm.30x.faandGCA_000146045.2_genomic.fna
By default, Merqury generates three collections as output: stats, plots and QV stats. The “stats” and “plots” collection contains the completeness statistics, while the “QV stats” collection contains the quality value statistics.
QuestionCompare the k-mers plots for the Flye and Hifiasm assembly and the reference genome. What do you observe ?
Merqury analysis confirms that Flye assembly is better than Hifiasm assembly. Hifiasm
assembly.spectra-cn.flshows that part of the data is specific to reads (black peak overlapping the red peak) indicating an absence of contigs in the assembly to represent these data.Flye it’s similar in completness to the reference genome with a single read peak. We note however that part of the reference genome assembly is specific and absent from the reads (red barplot on the left). This is because the sequencing data is from a different strain (INSC1019) than the reference genome (S288C).
Evaluation against reference genome with Chromeister
Chromeister is used to generate dotplots to quickly compare sequence sets, even for large genomes. This is provide a synthetic similarity overview, highlighting repetitions, breaks and inversions.
Hands On: Synteny evaluation with Chromeister
- Chromeister ( Galaxy version 1.5.a+galaxy1) with the following parameters:
- param-files “Query sequence”:
Scerevisiae-INSC1019.flye.30x.faandScerevisiae-INSC1019.hifiasm.30x.fa- param-file “Reference sequence”:
GCA_000146045.2_genomic.fna
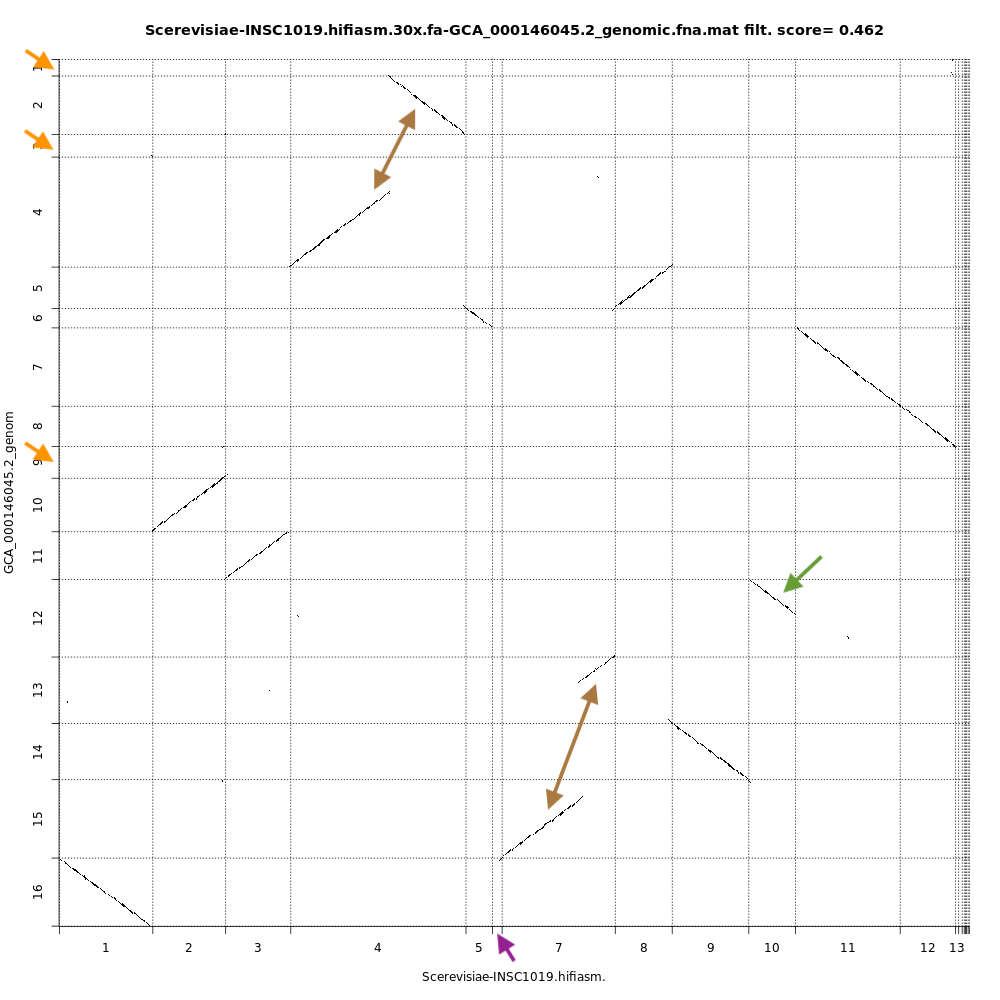
QuestionCompare the dotplots for the Hifiasm assembly and the reference genome. What do you observe ?
With dotplots, we can quickly detect several inconsistencies between the assembly generated by Hifiasm and the reference genome:
- Orange arrows indicate contigs in the reference genome that are absent in the Hifiasm assembly
- Purple arrow indicates a contig specific to the Hifiasm assembly. This is not necessarily an inconsistency as it is 2 different strains of the same species.
- Brown arrows indicate contigs that are merged into the Hifiasm assembly. In the case of the top arrow, there is a fusion and a partial inversion.
- Green arrow indicates a contig partially assembled by Hifiasm.
Conclusion
This pipeline shows how to evaluate a genome assembly. Once you are satisfied with your genome sequence, you might want to purge it, make scaffolding and directly starting the annotation process!
You've Finished the Tutorial
Key points
Quast, BUSCO and Merqury make it easy to assess the quality of an assembly
Post-processing can be necessary (purging, scaffolding) before annotation
Frequently Asked Questions
Have questions about this tutorial? Have a look at the available FAQ pages and support channelsFeedback
Did you use this material as an instructor? Feel free to give us feedback on how it went.
Did you use this material as a learner or student? Click the form below to leave feedback.

Citing this Tutorial
- Anthony Bretaudeau, Alexandre Cormier, Erwan Corre, Laura Leroi, Stéphanie Robin, Genome Assembly Quality Control (Galaxy Training Materials). https://training.galaxyproject.org/training-material/topics/assembly/tutorials/assembly-quality-control/tutorial.html Online; accessed TODAY
- Hiltemann, Saskia, Rasche, Helena et al., 2023 Galaxy Training: A Powerful Framework for Teaching! PLOS Computational Biology 10.1371/journal.pcbi.1010752
- Batut et al., 2018 Community-Driven Data Analysis Training for Biology Cell Systems 10.1016/j.cels.2018.05.012
Congratulations on successfully completing this tutorial!@misc{assembly-assembly-quality-control, author = "Anthony Bretaudeau and Alexandre Cormier and Erwan Corre and Laura Leroi and Stéphanie Robin", title = "Genome Assembly Quality Control (Galaxy Training Materials)", year = "", month = "", day = "", url = "\url{https://training.galaxyproject.org/training-material/topics/assembly/tutorials/assembly-quality-control/tutorial.html}", note = "[Online; accessed TODAY]" } @article{Hiltemann_2023, doi = {10.1371/journal.pcbi.1010752}, url = {https://doi.org/10.1371%2Fjournal.pcbi.1010752}, year = 2023, month = {jan}, publisher = {Public Library of Science ({PLoS})}, volume = {19}, number = {1}, pages = {e1010752}, author = {Saskia Hiltemann and Helena Rasche and Simon Gladman and Hans-Rudolf Hotz and Delphine Larivi{\`{e}}re and Daniel Blankenberg and Pratik D. Jagtap and Thomas Wollmann and Anthony Bretaudeau and Nadia Gou{\'{e}} and Timothy J. Griffin and Coline Royaux and Yvan Le Bras and Subina Mehta and Anna Syme and Frederik Coppens and Bert Droesbeke and Nicola Soranzo and Wendi Bacon and Fotis Psomopoulos and Crist{\'{o}}bal Gallardo-Alba and John Davis and Melanie Christine Föll and Matthias Fahrner and Maria A. Doyle and Beatriz Serrano-Solano and Anne Claire Fouilloux and Peter van Heusden and Wolfgang Maier and Dave Clements and Florian Heyl and Björn Grüning and B{\'{e}}r{\'{e}}nice Batut and}, editor = {Francis Ouellette}, title = {Galaxy Training: A powerful framework for teaching!}, journal = {PLoS Comput Biol} }
Do you want to extend your knowledge?Follow one of our recommended follow-up trainings:
You can use Ephemeris's
shed-tools installcommand to install the tools used in this tutorial.shed-tools install [-g GALAXY] [-a API_KEY] -t <(curl https://training.galaxyproject.org/training-material/api/topics/assembly/tutorials/assembly-quality-control/tutorial.json | jq .admin_install_yaml -r)Alternatively you can copy and paste the following YAML
---
install_tool_dependencies: true
install_repository_dependencies: true
install_resolver_dependencies: true
tools:
- name: busco
  owner: iuc
  revisions: 41030a6c03b7
  tool_panel_section_label: Annotation
  tool_shed_url: https://toolshed.g2.bx.psu.edu/
- name: chromeister
  owner: iuc
  revisions: b768cc4cca40
  tool_panel_section_label: Multiple Alignments
  tool_shed_url: https://toolshed.g2.bx.psu.edu/
- name: merqury
  owner: iuc
  revisions: f8113c25bc6b
  tool_panel_section_label: Assembly
  tool_shed_url: https://toolshed.g2.bx.psu.edu/
- name: meryl
  owner: iuc
  revisions: 29dabd8db6f2
  tool_panel_section_label: Assembly
  tool_shed_url: https://toolshed.g2.bx.psu.edu/
- name: quast
  owner: iuc
  revisions: 3061c8b029e5
  tool_panel_section_label: Assembly
  tool_shed_url: https://toolshed.g2.bx.psu.edu/