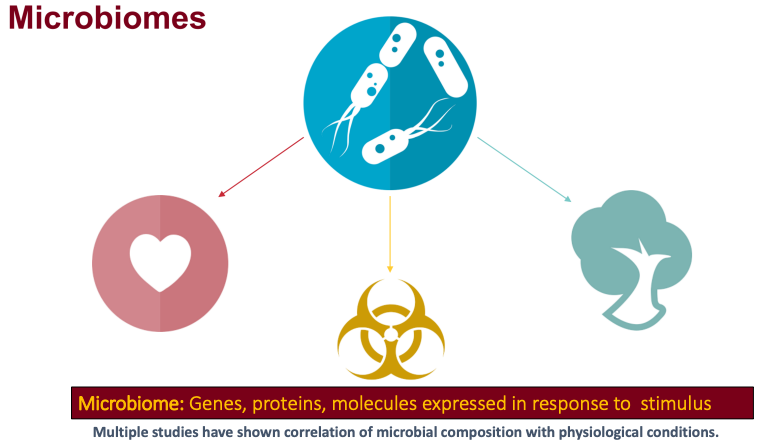
Metaproteomics “Metaproteomics video” involves the characterization of community-level expression of microbial proteins from an environmental
or clinical sample. Metaproteomics data “Metaproteomics community effort”Jagtap et al. 2015 is primarily used to determine the functional status of the microbiome under study along with its taxonomic composition. The Galaxy-PMetaproteomics team published a software suite named metaQuantome Easterly et al. 2019 to enable quantitative and statistical analysis and visualization of functional,
taxonomic expression as well as functional and taxonomy interaction. metaQuantome leverages peptide-level quantitative information to analyze the taxonomic, functional expression within the microbial community in different conditions.
metaQuantome offers differential abundance analysis, principal components analysis, and clustered heat map visualizations,
across multiple experimental conditions. metaQuantome, an open-source tool, is available via the command line and also
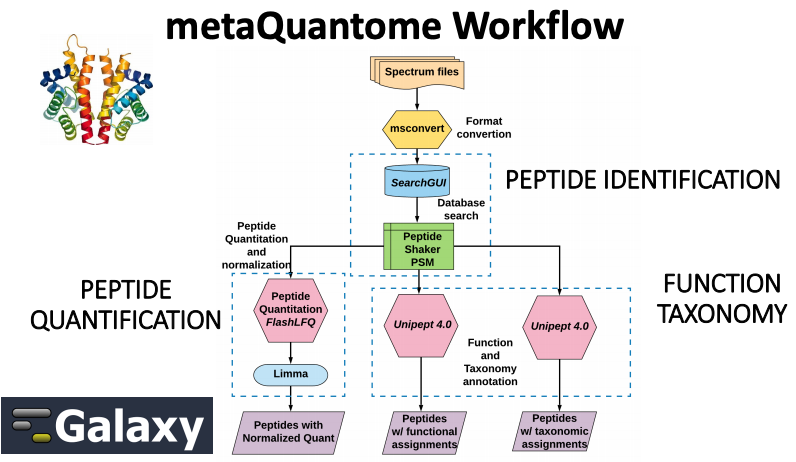
accessible via Galaxy platform for reproducible analysis. As a first step for metaQuantome analysis, metaproteomics
data needs to be made compatible for subsequent analysis. With this in mind, we have developed a metaQuantome data
generation workflow tutorial that will help users generate inputs for metaQuantome analysis.
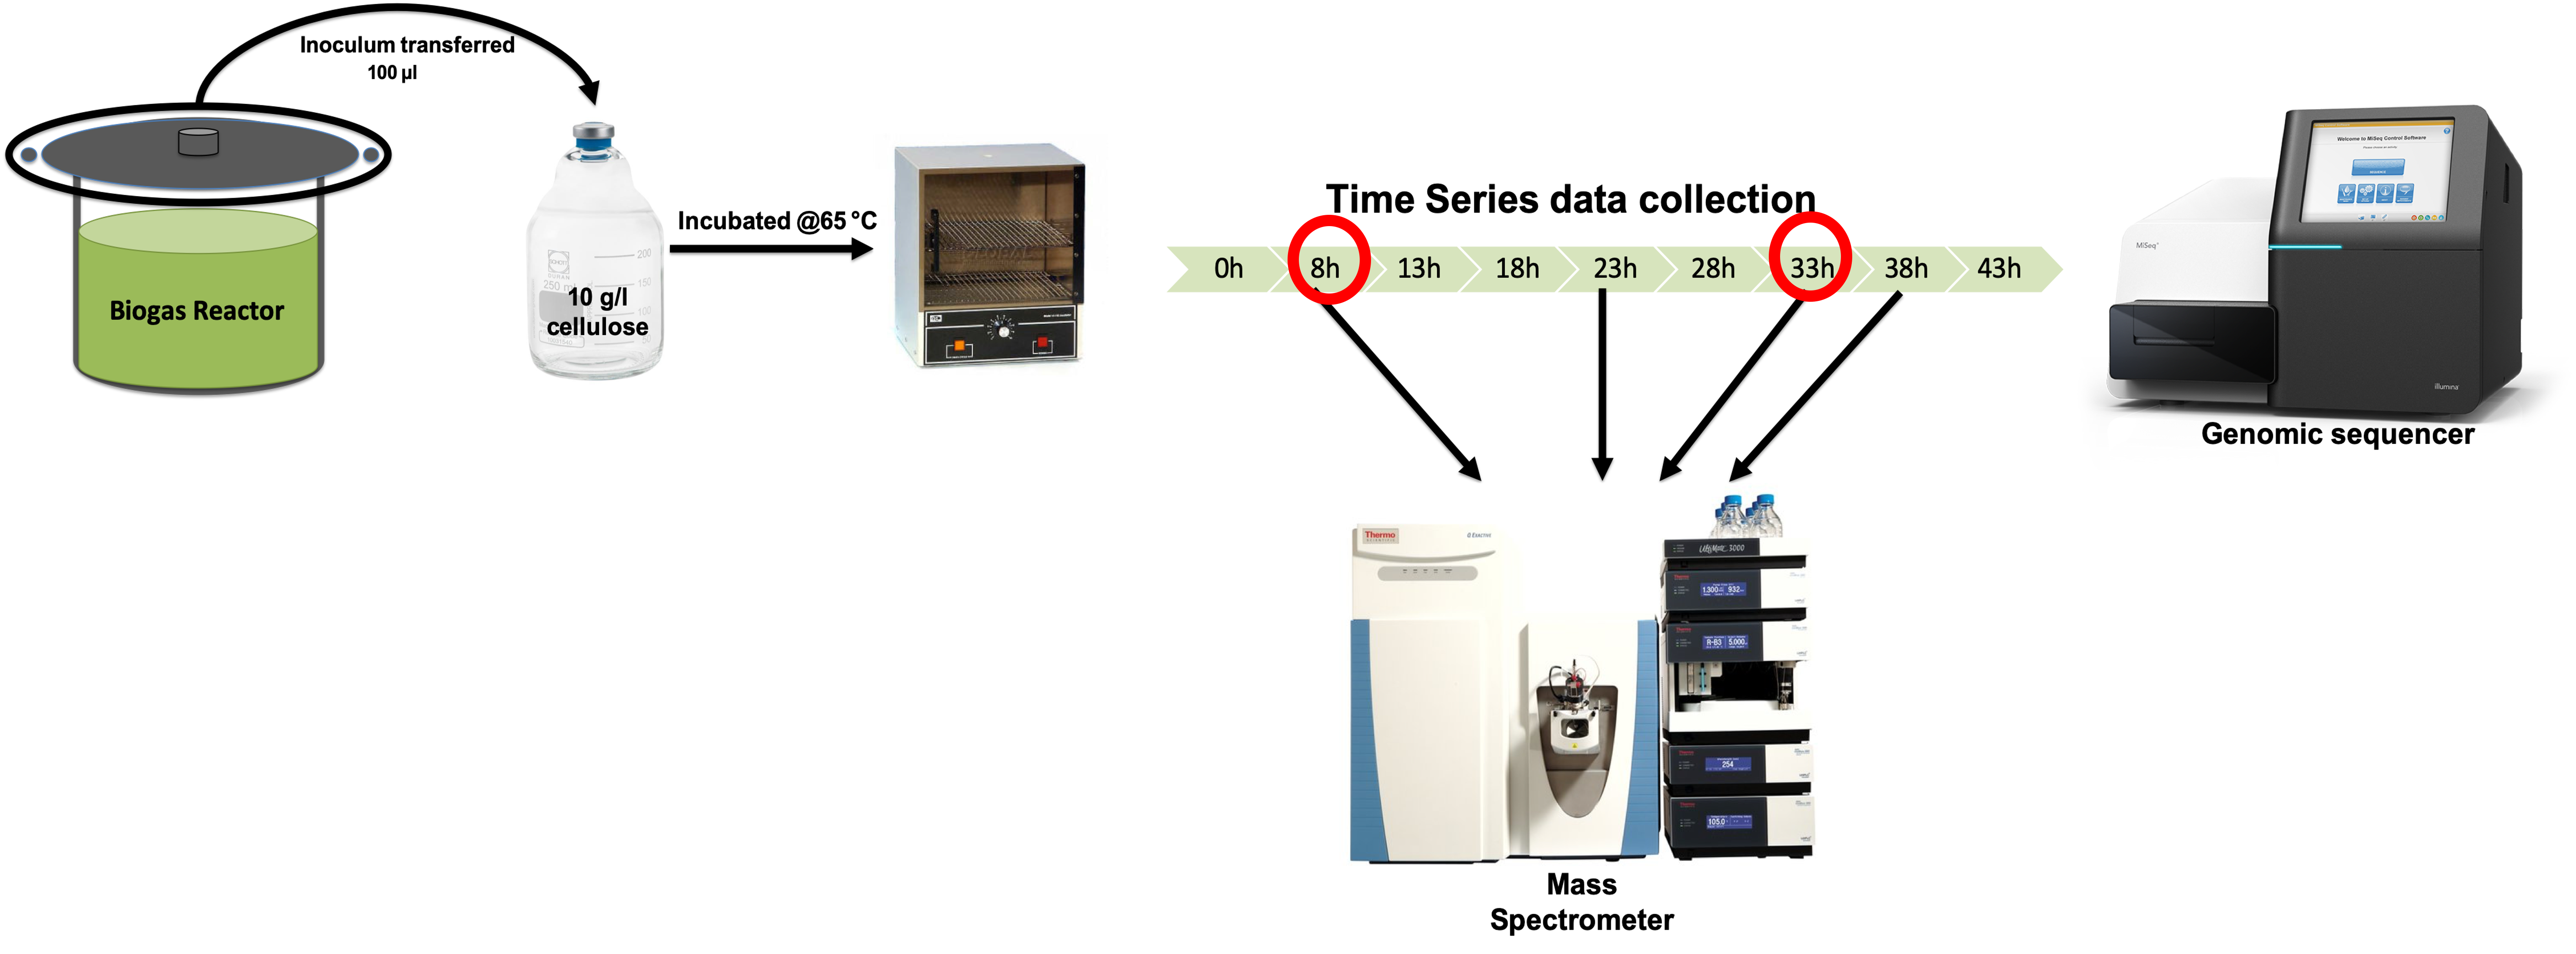
To demonstrate the use of the data creation workflow, we have used a thermophilic biogas reactor dataset wherein municipal
food waste and manure is digested to generate methane gas. After one round in the reactor, the microbial community was
simplified and enriched via serial dilution. This inoculum was then transferred to a solution of cellulose from Norwegian
Spruce and incubated at 65°C. Triplicate samples were taken in a time series from 0 to 43 hours after inoculation and mass
spectrometry data was acquired on a Q-Exactive (Thermo) mass spectrometer. For this training, we have chosen two time points 8-hour and 33-hour.
The first step in a tutorial is to get the data from the zenodo link provided and making sure that it is in the correct format.
Get data
Hands On: Data upload
Create a new history for this tutorial and give it a meaningful name
To create a new history simply click the new-history icon at the top of the history panel:
Click on galaxy-pencil (Edit) next to the history name (which by default is “Unnamed history”)
Type the new name
Click on Save
To cancel renaming, click the galaxy-undo “Cancel” button
If you do not have the galaxy-pencil (Edit) next to the history name (which can be the case if you are using an older version of Galaxy) do the following:
Click on Unnamed history (or the current name of the history) (Click to rename history) at the top of your history panel
Type the new name
Press Enter
Import the files: 6 MZML files, a Protein FASTA file, and an Experimental Design file from Zenodo
or from the shared data library (GTN - Material -> proteomics -> metaQuantome 1: Data creation)
Click galaxy-uploadUpload at the top of the activity panel
Select galaxy-wf-editPaste/Fetch Data
Paste the link(s) into the text field
Press Start
Close the window
As an alternative to uploading the data from a URL or your computer, the files may also have been made available from a shared data library:
Go into Libraries (left panel)
Navigate to the correct folder as indicated by your instructor.
On most Galaxies tutorial data will be provided in a folder named GTN - Material –> Topic Name -> Tutorial Name.
Select the desired files
Click on Add to Historygalaxy-dropdown near the top and select as Datasets from the dropdown menu
In the pop-up window, choose
“Select history”: the history you want to import the data to (or create a new one)
Click on Import
Rename the datasets (If needed)
Check that the datatype ( Make sure they are in the correct formats).
6 MZML files (format=mzml, a Protein FASTA file (format=fasta), and an Experimental Design file (format=tabular)
Click on the galaxy-pencilpencil icon for the dataset to edit its attributes
In the central panel, click galaxy-chart-select-dataDatatypes tab on the top
In the galaxy-chart-select-dataAssign Datatype, select datatypes from “New Type” dropdown
Tip: you can start typing the datatype into the field to filter the dropdown menu
Click the Save button
Add to each database a tag corresponding to the name of the input data (optional).
Build a Dataset list for the four mzml files.
Click the galaxy-selectorSelect Items check box at the top of the history panel
Click on galaxy-selectorSelect Items at the top of the history panel
Check all the datasets in your history you would like to include
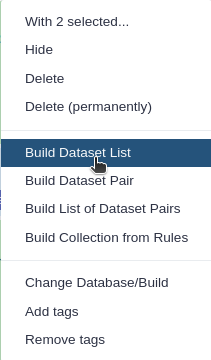
Click n of N selected and choose Advanced Build List
You are in collection building wizard. Choose Flat List and click ‘Next’ button at the right bottom corner.
Double clcik on the file names to edit. For example, remove file extensions or common prefix/suffixes to cleanup the names.
Enter a name for your collection
Click Build to build your collection
Click on the checkmark icon at the top of your history again
Rename the dataset collection as MZML dataset collection.
We have a choice to run all these steps using a single workflow, then discuss each step and the results in more detail.
Click on galaxy-workflows-activityWorkflows in the Galaxy activity bar (on the left side of the screen, or in the top menu bar of older Galaxy instances). You will see a list of all your workflows
Click on galaxy-uploadImport at the top-right of the screen
Paste the following URL into the box labelled “Archived Workflow URL”: https://training.galaxyproject.org/training-material/topics/proteomics/tutorials/metaquantome-data-creation/workflows/main_workflow.ga
Click the Import workflow button
Below is a short video demonstrating how to import a workflow from GitHub using this procedure:
Video: Importing a workflow from URL
Run Workflowworkflow using the following parameters:
param-file“4: In FlashLFQ - control condition for Bayesian protein fold-change analysis”: S1
Click on Workflows on the Activity Bar on the left.
At the top of the resulting page you will have the option to switch between the My workflows, Workflows shared with me and Public workflows tabs.
Select the tab you want to see all workflows in that category
Search for your desired workflow.
Click on the workflow name: a pop-up window opens with a preview of the workflow.
To run it directly: click Run (top-right).
Recommended: click Import (left of Run) to make your own local copy under Workflows / My Workflows.
Match peptide sequences
For this, the sequence database-searching program called SearchGUI will be used.
The created dataset collection of the four MZML files in the history has to be first converted to MGF to be used as the MS/MS input.
Convert mzml to MGF with msconvert
msconvert is used in order to convert the input file type, a mzml data collection, to a mgf file type.
The mgf file type can then be used as the Input Peak Lists when running SearchGUI.
Hands On: mzml to MGF
msconvert ( Galaxy version 3.0.19052.0) with the following parameters:
param-collection“Input unrefined MS data”: MZML dataset collection
“Do you agree to the vendor licenses?”: Yes
“Output Type”: mgf
In “Data Processing Filters”:
“Apply peak picking?”: Yes
“Apply m/z refinement with identification data?”: No
“(Re-)calculate charge states?”: No
“Filter m/z Window”: No
“Filter out ETD precursor peaks?”: No
“De-noise MS2 with moving window filter”: No
In “Scan Inclusion/Exclusion Filters”:
“Filter MS Levels”: No
In “General Options”:
“Sum adjacent scans”: No
“Output multiple runs per file”: No
Comment
This is a critical step for running this workflow.
Question
Why do we need to convert the files to MGF?
Can we use any other input format?
The files have to be converted to MGF for this workflow because we use SearchGUI as the searching tool and it can only read MGF files.
Yes, we can also use RAW files as input and just convert RAW files to MGF.
Search GUI
SearchGUI is a tool that searches sequence databases on any number of MGF files. In this case, the previously made collection of three MGF files (entitles MGF files) will be used as the MS/MS input. This tool will produce an output file, called a SearchGUI archive file. This file will serve as in input for the next tool used, PeptideShaker.
Hands On: Search sequence databases
Search GUI ( Galaxy version 3.3.10.1) with the following parameters:
param-file“Input Peak Lists (mgf)”: output (output of msconverttool)
In “Search Engine Options”:
“DB-Search Engines”: X!tandem
In “Protein Digestion Options”:
“Digestion”: Trypsin
“Maximum Missed Cleavages”: 2
In “Precursor Options”:
“Fragment Tolerance”: 0.2
“Maximum Charge”: 6
In “Protein Modification Options”:
“Fixed Modifications”: Carbamidomethylation of C
“Variable Modifications”: Oxidation of M, Acetylation of Protein N-term
In “Andvanced Options”:
“SearchGUI Options”: Default
“X!Tandem Options”: Advanced
“X!Tandem: Quick Acetyl”: No
“X!Tandem: Quick Pyrolidone”: No
“X!Tandem: Maximum Valid Expectation Value”: 100.0
“X!Tandem peptide model refinement”: Don't refine
“OMSSA Options”: Default
“MSGF Options”: Default
“MS Amanda Options”: Default
“TIDE Options”: Default
“MyriMatch Options”: Default
“Comet Options”: Default
“DirectTag Options”: Default
“Novor Options”: Default
Comment
Note that sequence databases used for metaproteomics are usually much larger than the excerpt used in this tutorial. When using large databases, the peptide identification step can take much more time for computation. In metaproteomics, choosing the optimal database is a crucial step of your workflow, for further reading see Timmins-Schiffman et al (2017). To learn more about database construction in general, like integrating contaminant databases or using a decoy strategy for FDR searching, please consult our tutorial on Database Handling.
Question
How many Search Engines can be used?
Can the parameters be manipulated?
There are 8 database search algorithms, you can use as many as you want. Ideally, 4 database algorithms gives the best results.
Yes, The parameters can be manipulated according to the experimental design of the datasets.
Peptide Shaker
PeptideShaker is a post-processing software tool that processes data from the SearchGUI software tool. PeptideShaker is a search engine for interpretation of proteomics identification results from multiple search engines, currently supporting X!Tandem, MS-GF+, MS Amanda, OMSSA, MyriMatch, Comet, Tide, Mascot, Andromeda and mzIdentML. More specifically, PeptideShaker processes data from the SearchGUI tool through the organization of Peptide-Spectral Matches (PSMs) generated. In addition to organization, it provides an assessment of confidence of the data and generates outputs that can be visualized by users to interpret the results.
Hands On: Interpretation of SearchGUI
Peptide Shaker ( Galaxy version 1.16.36.3) with the following parameters:
param-file“Compressed SearchGUI results”: searchgui_results (output of Search GUItool)
“Specify Contact Information for mzIdendML”: GalaxyP Project contact (Not suitable for PRIDE submission)
In “Exporting options”:
“Creates a mzIdentML file”: Yes
“Compress results into a single zip file”: No
“Reports to be generated”: PSM Report, Peptide Report, Protein Report, Certificate of Analysis,
Comment
There are a number of choices for different data files that can be generated using
PeptideShaker. A compressed file can be made containing all information needed to view the
results in the standalone PeptideShaker viewer. A mzidentML file can be created that contains
all peptide sequence matching information and can be utilized by compatible downstream
software. Other outputs are focused on the inferred proteins identified from the PSMs, as well
as phosphorylation reports, relevant if a phosphoproteomics experiment has been undertaken.
More detailed information on peptide inference using SearchGUI and PeptideShaker can be found in
our tutorial on Peptide and Protein ID.
Removing Contaminants
Hands On: Remove contaminants from PSM report
This Select tool is used to remove all the contaminants from the Peptide Spectral Match (PSM) search results.
Select with the following parameters:
param-file“Select lines from”: output_psm (PSM report output of Peptide Shakertool)
“that”: NOT Matching
“the pattern”: con_
Rename galaxy-pencil to output file to PSM_Report_no_contaminants
Click on the galaxy-pencilpencil icon for the dataset to edit its attributes
In the central panel, change the Name field
Click the Save button
Hands On: Removing contaminants from Peptide report
Select with the following parameters:
param-file“Select lines from”: output_peptides (Peptide Report output of Peptide Shakertool)
“that”: NOT Matching
“the pattern”: con_
Rename galaxy-pencil the output file to Peptide_Report_no_contaminants
Comment
In Proteomics, contamination is generally detected as peaks in spectra that did not originate
from the samples and can be introduced in the sample from a variety of environmental sources or human error. Identification of these
contaminants is critical to enable their removal before data analysis, mainly, to maintain the validity of conclusions
drawn from statistical analyses. Thus, this selection tool helps us remove the contaminants that were identified in the spectral data.
Question
Why is removing contaminants important?
Ideally, we would like to remove known contaminants from our samples just to maintain discovering novel proteoforms in our sample.
Removing file extensions for Quantification
This is a data manipulation step to make the data compatible with other downstream processing tools. The Replace text tool replaces the .mgf extension from the PSM report so that it can be used as an input for FlashLFQ.
Hands On: Removing file extensions
Replace Text in a specific column ( Galaxy version 1.1.3) with the following parameters:
param-file“File to process”: PSM_Report_no_contaminants (output of Selecttool)
In “Replacement”:
param-repeat“Insert Replacement”
“in column”: Column: 10
“Find pattern”: .mzml.mgf
Rename Input_for_FlashLFQ.
Comment
Replace Text searches given columns and finds and replaces patterns provided by the user.
This tool is removing the extensions (.raw,.mzml,.mgf) in the spectral file column provided by the PeptideShaker tool. This step is critical for FlashLFQ to work.
Extracting Peptide list
Hands On: Selecting peptide list
This step selects the peptide column from the Select output ( where we have removed the contaminants)
Cut with the following parameters:
“Cut columns”: c6
param-file“From”: Peptide_Report_no_contaminants (output of Selecttool)
Rename file as peptide_list.
Peptide Quantification
In this tutorial, we are using FlashLFQ as the quantitation tool. The user can choose to work with other quantitation tools, e.g. moFF and MaxQuant are available in Galaxy.
FlashLFQ
FlashLFQ can quantify MS peaks in order to find the abundances of peptides. FlashLFQ is a fast label-free quantification algorithm. Additionally, the abundances of peptides within the sample can be compared between samples as further analysis beyond this workflow.
Hands On: Quantification
FlashLFQ ( Galaxy version 1.0.3.0) with the following parameters:
param-file“identification file”: Input_for_FlashLFQ (output of Replace Texttool)
“Perform Bayesian protein fold-change analysis”: Yes
“control condition for Bayesian protein fold-change analysis”: S1
Comment
FlashLFQ is a label-free quantification tool for mass-spectrometry proteomics. It supports both .mzML and Thermo .raw file formats.
To run FlashLFQ on Galaxy, there are three main input files:
PSM report from Peptide Shaker (Input_for_FlashLFQ)
MZML/ RAW spectrum files (MZML dataset collection)
Experimental Design File ( ExperimentalDesign.tsv)
The Experimental Design file should be a tabular file with a “File”, “Condition”, “Sample”, “Fraction”, and “Replicate” column. The “File” column should match your mzml spectrum file name.
Question
Can FlashLFQ be used with fractionated data?
Does FlashLFQ perform peptide and protein level quantification?
Yes, FlashLFQ can be used with fractionated datasets and multiple conditions
FlashLFQ performed both peptide level and protein level quantification. For protein level, FlashLFQ used Bayesian Fold change analysis.
Filtering peptides that are less than 50 amino acids
Hands On: Extracting peptides<50 amino acids
This is a data manipulation tool. Here, we select those peptides with less than 50 amino acids in length.
Filter data on any column using simple expressions with the following parameters:
param-file“Filter”: peptide_list (output of Cuttool)
“With following condition”: len(c1)<=50
“Number of header lines to skip”: 1
Rename as Unipept_peptide_list.
Comment
Unipept fails with peptides more than 50 amino acids in length, thus we decided to work with peptides that are less than 50 amino acids.
Manipulating text for metaQuantome
Hands On: Text manipulation for metaQuantome intensity file
Regex Find And Replace goes line by line through the input file and will remove any patterns specified by the user and replace them with expressions also specified by the user. In this case, Regex Find And Replace is being used on a FlashLFQ output file and manipulating the header to make it compatible with metaQuantome along with completely removing the N-terminus and C-terminus tag in the peptide sequences.
Regex Find And Replace ( Galaxy version 1.0.0) with the following parameters:
param-file“Select lines from”: QuantifiedPeptides (output of FlashLFQtool)
In “Check”:
param-repeat“Insert Check”
“Find Regex”: Base Sequence
“Replacement”: peptide
param-repeat“Insert Check”
“Find Regex”: Intensity_
param-repeat“Insert Check”
”Find Regex”: NH2-
”Replacement”: leave it blank
param-repeat“Insert Check”
”Find Regex”: -COOH
”Replacement”: leave it blank
Rename the file as Intensity
Functional and Taxonomy annotation
Unipept for taxonomy annotation
Unipept Mesuere et al. 2018 is used again to match tryptic peptides and find the taxonomy and lowest common ancestor of each peptide.
Hands On: Taxonomy annotation
Unipept ( Galaxy version 4.0.0) with the following parameters:
“Unipept application”: pept2lca: lowest common ancestor
“Equate isoleucine and leucine”: Yes
“allfields”: Yes
“Peptides input format”: tabular
param-file“Tabular Input Containing Peptide column”: Unipept_peptide_list (output of Filtertool)
“Select column with peptides”: c1
“Choose outputs”: Select all
Comment
There are two Unipept in this workflow, One for taxonomy and other for function.
Question
Can any other taxonomy and functional tool be used apart from Unipept?
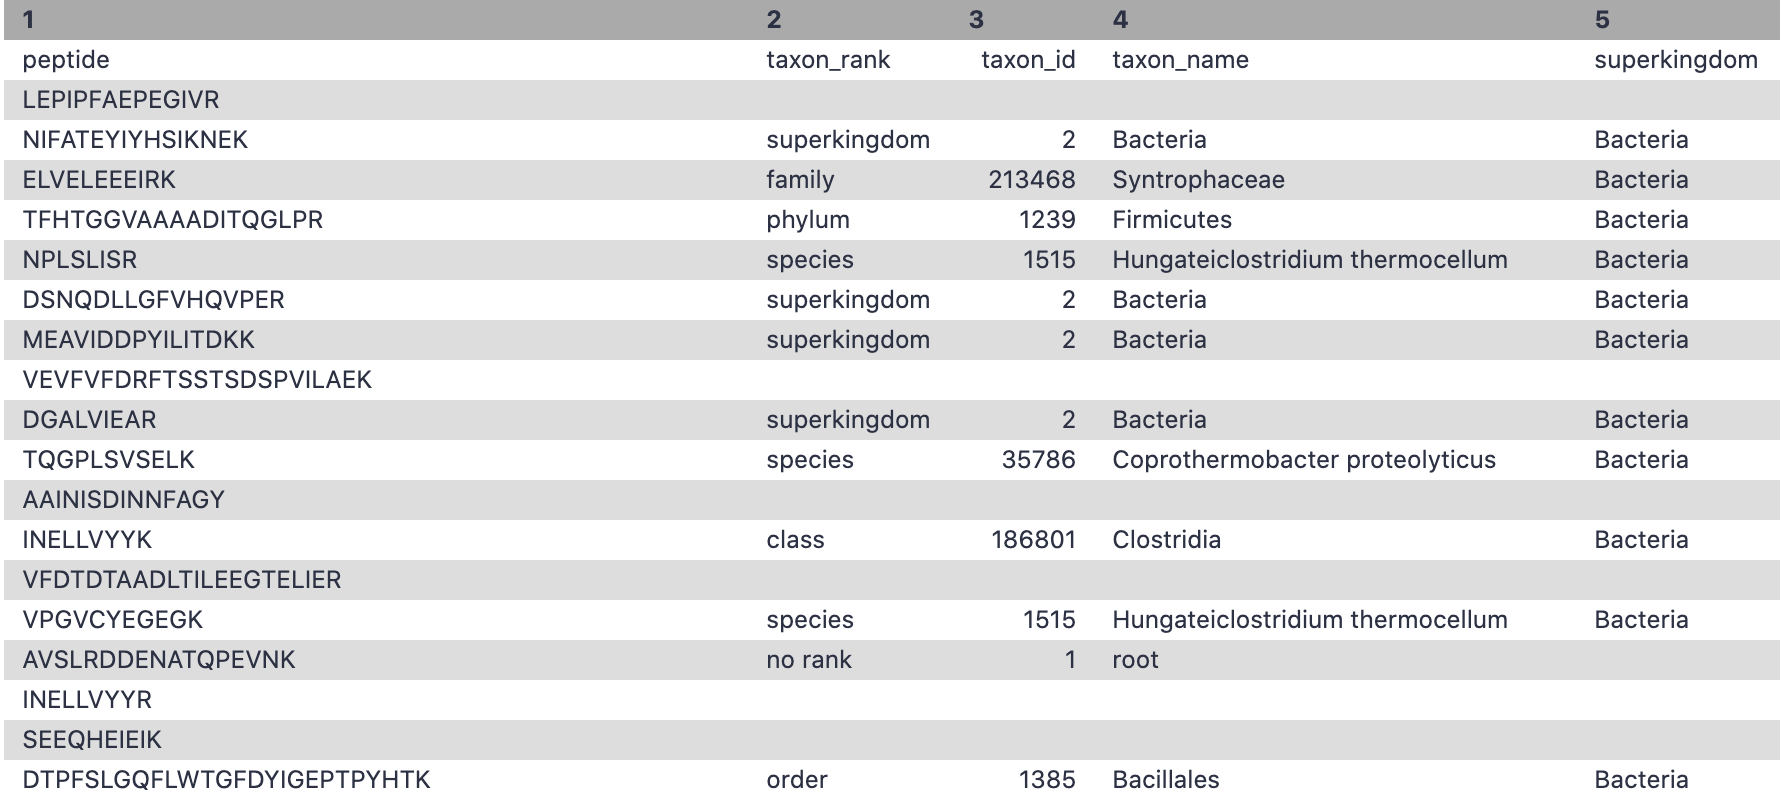
Yes, any tool can be used for taxonomy and functional output. Please make sure the output has the information that includes peptide,taxon_name, taxon_id, genus, species etc.
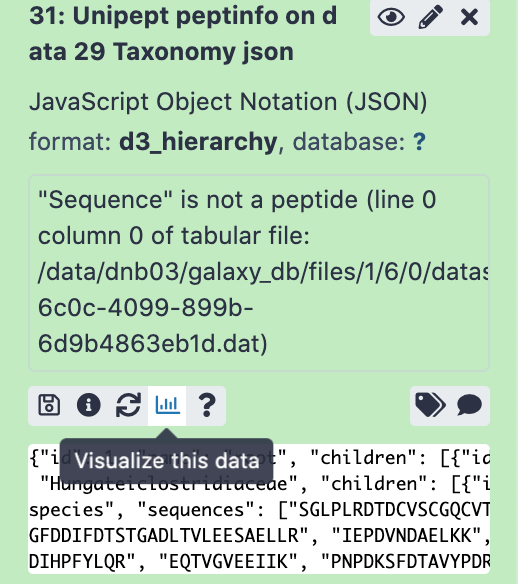
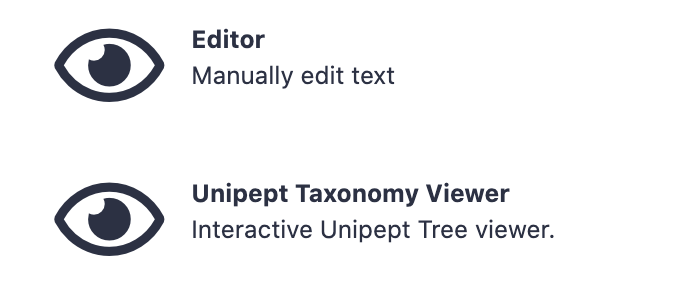
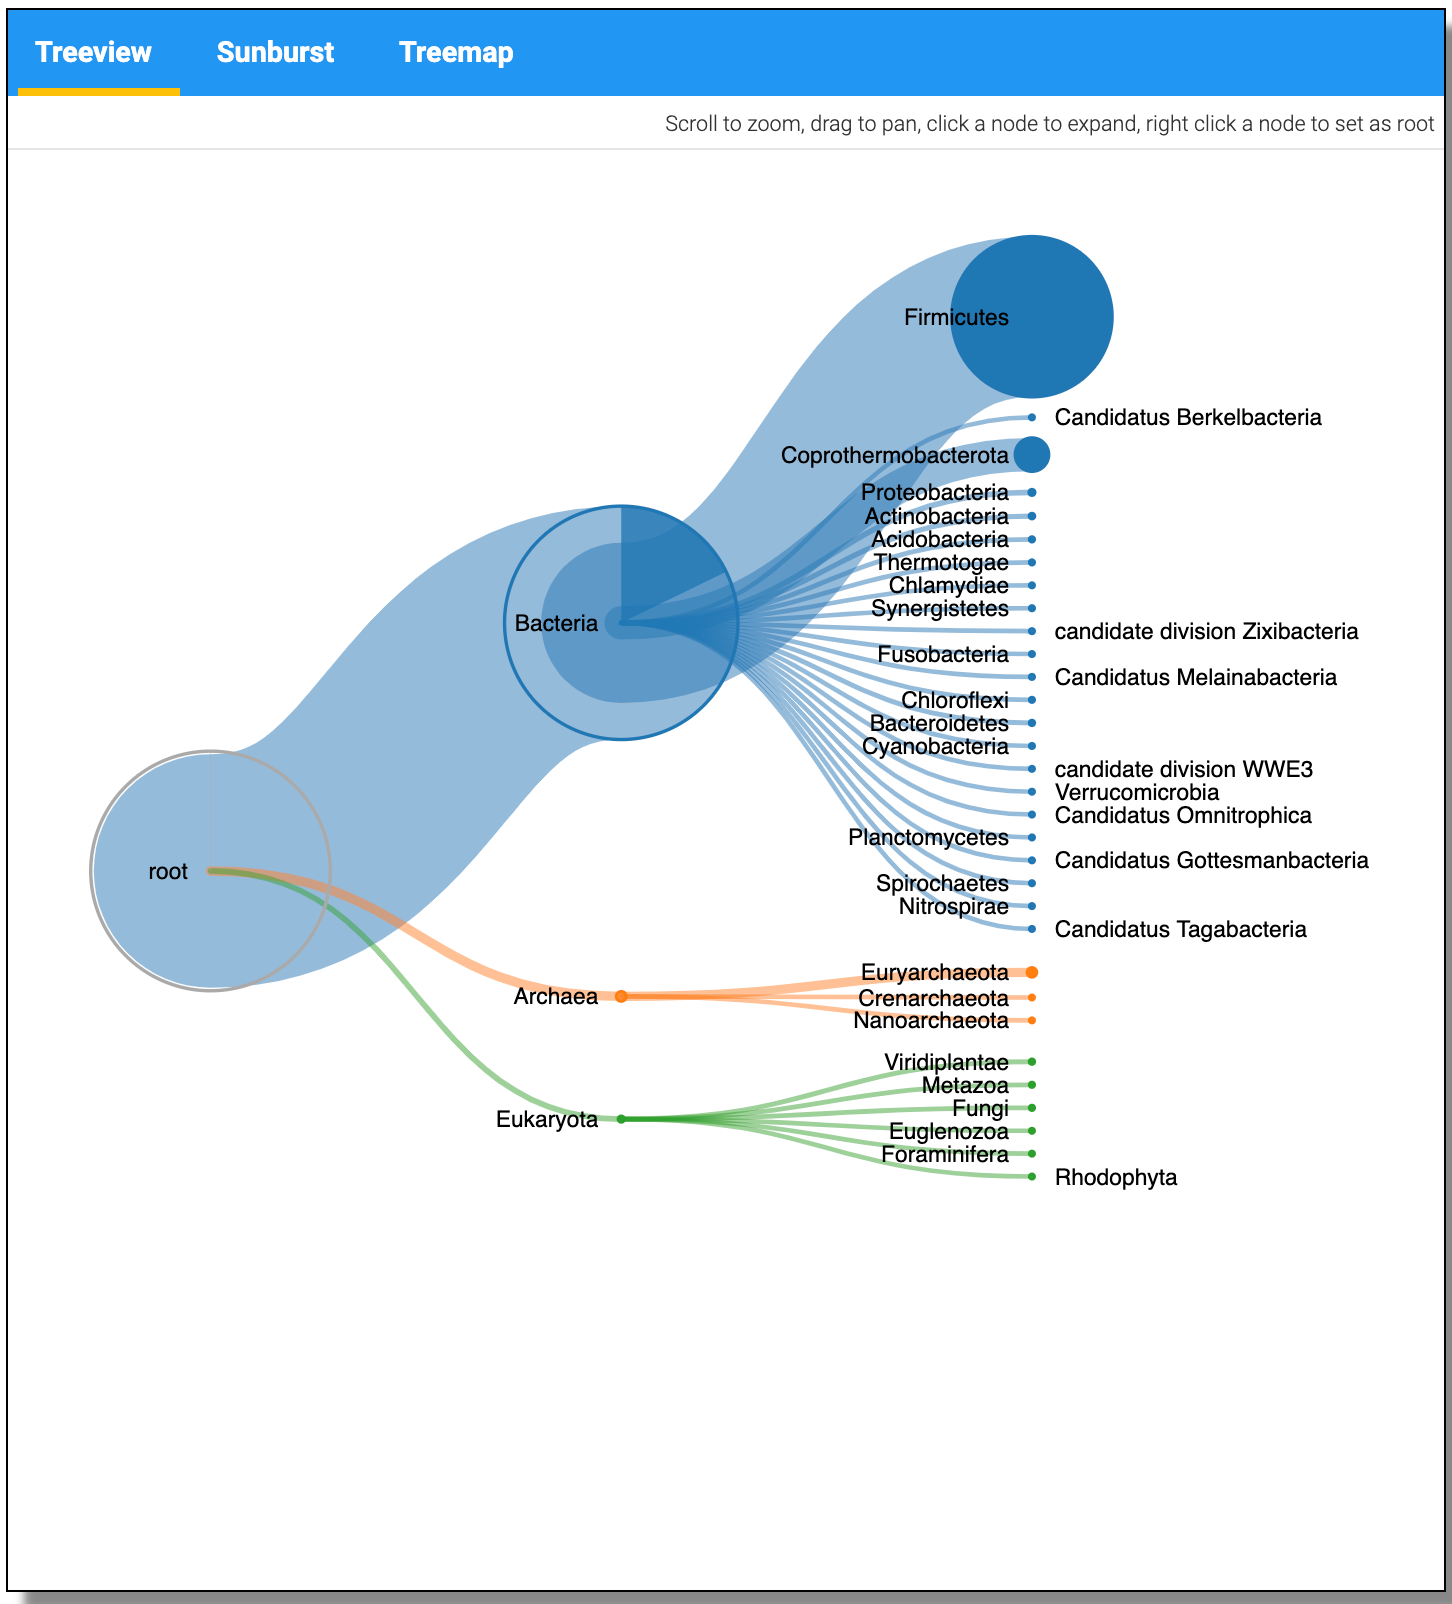
The JSON output from the Taxonomy can be visualized using the visualize option and Select the Unipept Taxonomyviewer.
Unipept for Functional annotation
Unipept is used to match tryptic peptides and find the taxonomy and Functional annotation of the peptides. Unipept is used to match sample tryptic peptides to proteins using a fast-matching algorithm. Although Unipept can be accessed and used through the web page, the use of Unipept on Galaxy allows the production of output datasets including the peptide information to be used in sequential steps. Unipept requires a list containing the peptide sequences which was generated by Query Tabular.
Hands On: Functional annotation
Unipept ( Galaxy version 4.3.0) with the following parameters:
“Unipept application”: peptinfo: Tryptic peptides and associated EC and GO terms and lowest common ancestor taxonomy
“Equate isoleucine and leucine”: Yes
“retrieve extra information”: Yes
“group responses by GO namespace (biological process, molecular function, cellular component)”: Yes
“allfields”: Yes
“Peptides input format”: tabular
param-file“Tabular Input Containing Peptide column”: Unipept_peptide_list (output of Filtertool)
“Select column with peptides”: c1
“Choose outputs”: Select all
Comment
There are two Unipept in this workflow, One for taxonomy and other for function. Please select all the output options from Unipept.
The JSON output from the Taxonomy can be visualized using the visualize option and Select the Unipept Taxonomyviewer.
Extracting EC values
Hands On: Extract EC numbers
The cut tool cuts out specific columns from the dataset. In this case, the cut tool is being used to extract columns 1 (peptide) and 3 (EC number) from the dataset peptinfo EC.tsv output. This is a manipulation tool for metaQuantome’s convenience.
Cut with the following parameters:
“Cut columns”: c1,c3
param-file“From”: output_ec_tsv (output of Unipepttool)
Rename EC_table.
Filtering confident peptides
Query Tabular is a tool that can load tabular data into a SQLite database. This step precedes UniPept, as a list containing the peptide sequences must be generated. In this step a list of gene ontology (GO) terms is being generated.
Hands On: Filtering confident peptides
Query Tabular ( Galaxy version 3.0.0) with the following parameters:
In “Database Table”:
param-repeat“Insert Database Table”
param-file“Tabular Dataset for Table”: output_go_tsv (output of Unipepttool)
SELECT Goterm.*
FROM Goterm
WHERE ((1.0*Goterm.protein_count)/(1.0*Goterm.total_protein_count)) >= 0.05
“include query result column headers”: Yes
Rename as Unipept_Function.
Comment
In the Unipept API output, the threshold is set to 0.5% of the overall number of peptides unambiguously assigned to a taxon at a particular taxonomic rank level. Here in the Galaxy platform, we are using Query tabular to perform this filtering.
Removing Hashtag from output
This step is to remove the hashtag from the Peptide header in the Unipept output.
Hands On: Remove # from peptide header
Replace Text ( Galaxy version 1.1.2) with the following parameters:
param-file“File to process”: Unipept_Function (output of Unipepttool)
In “Replacement”:
param-repeat“Insert Replacement”
“Find pattern”: #peptide
“Replace with:”: peptide
Rename file as All_functions
Filter - EC values
We are using this Query tabular to rename the output that we obtained from the Cut column tool.
Hands On: Extracting EC for metaQuantome
Query Tabular ( Galaxy version 3.0.0) with the following parameters:
In “Database Table”:
param-repeat“Insert Database Table”
param-file“Tabular Dataset for Table”: EC_table (output of Cuttool)
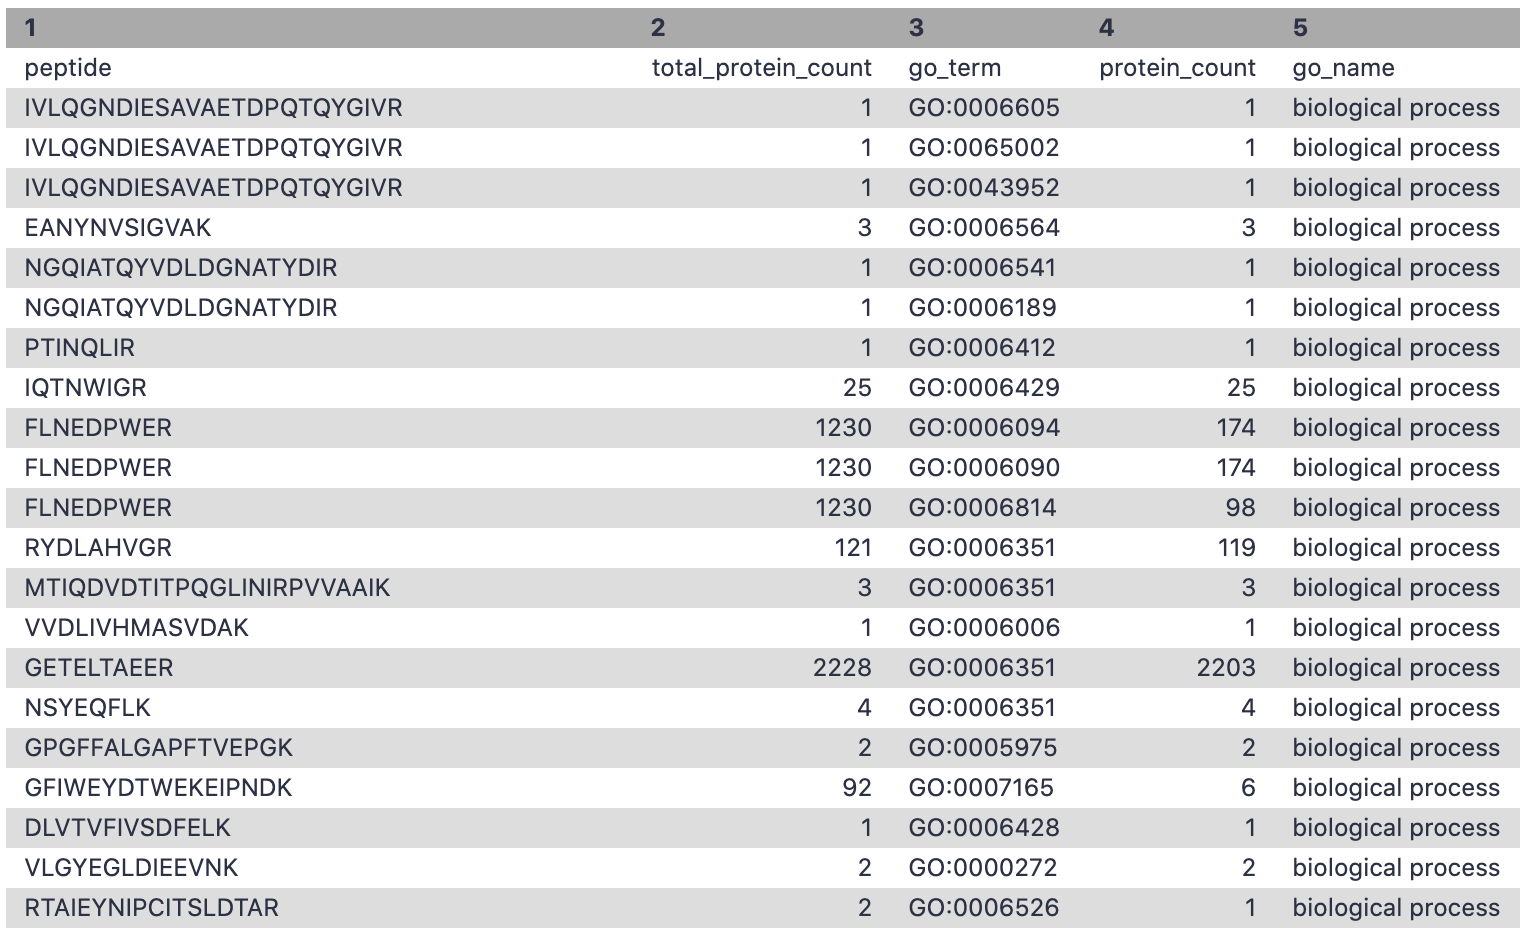
The filter tool allows restriction of the dataset using simple conditional statements. This step is used to filter out the GO terms with biological processes and the corresponding number of peptides associated with these terms.
Hands On: Extracting biological processes for metaQuantome
Filter with the following parameters:
param-file“Filter”: Unipept_Function (output of Query Tabulartool)
“With following condition”: c5=='biological process'
“Number of header lines to skip”: 1
Rename file as go_bp
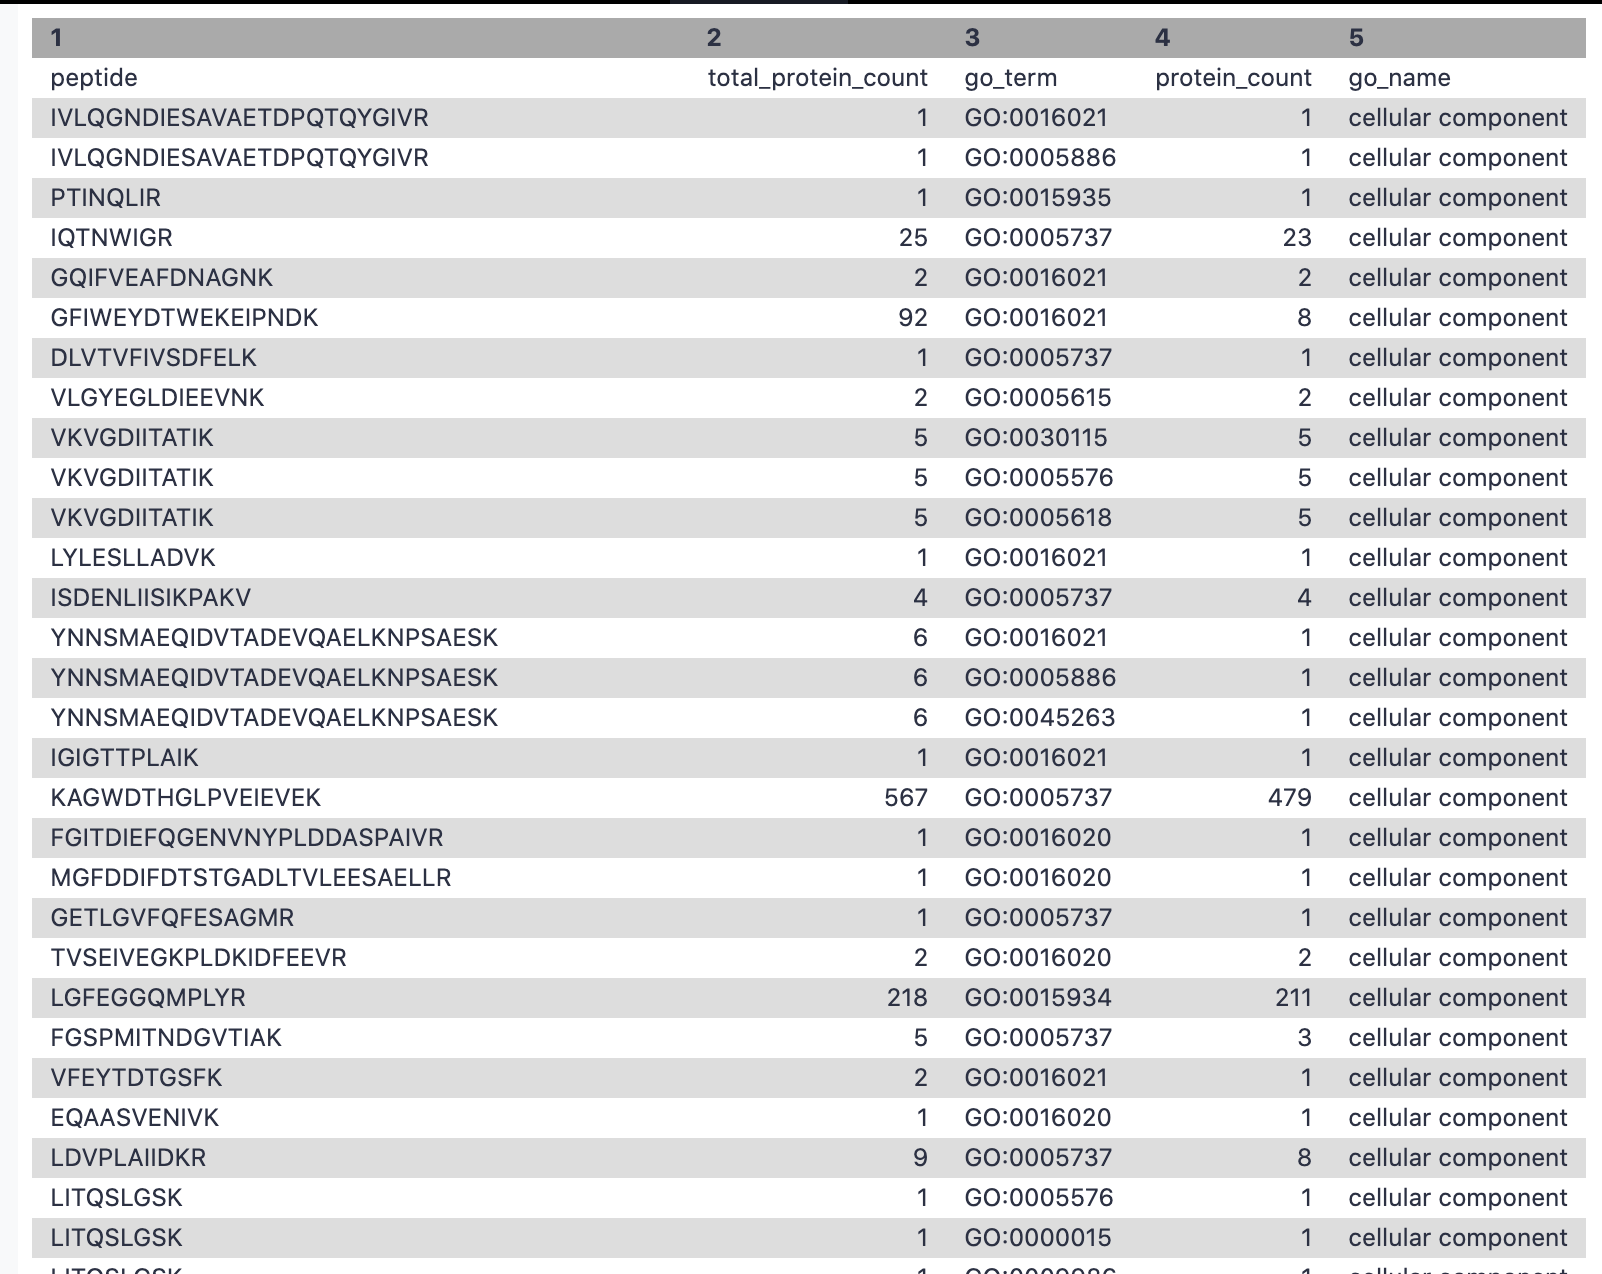
Filter - Cellular components
This step is used to filter out the GO terms with cellular components and the corresponding number of peptides associated with these terms.
Hands On: Extracting cellular component for metaQuantome
Filter with the following parameters:
param-file“Filter”: Unipept_Function (output of Query Tabulartool)
“With following condition”: c5=='cellular component'
“Number of header lines to skip”: 1
Rename file as go_cc
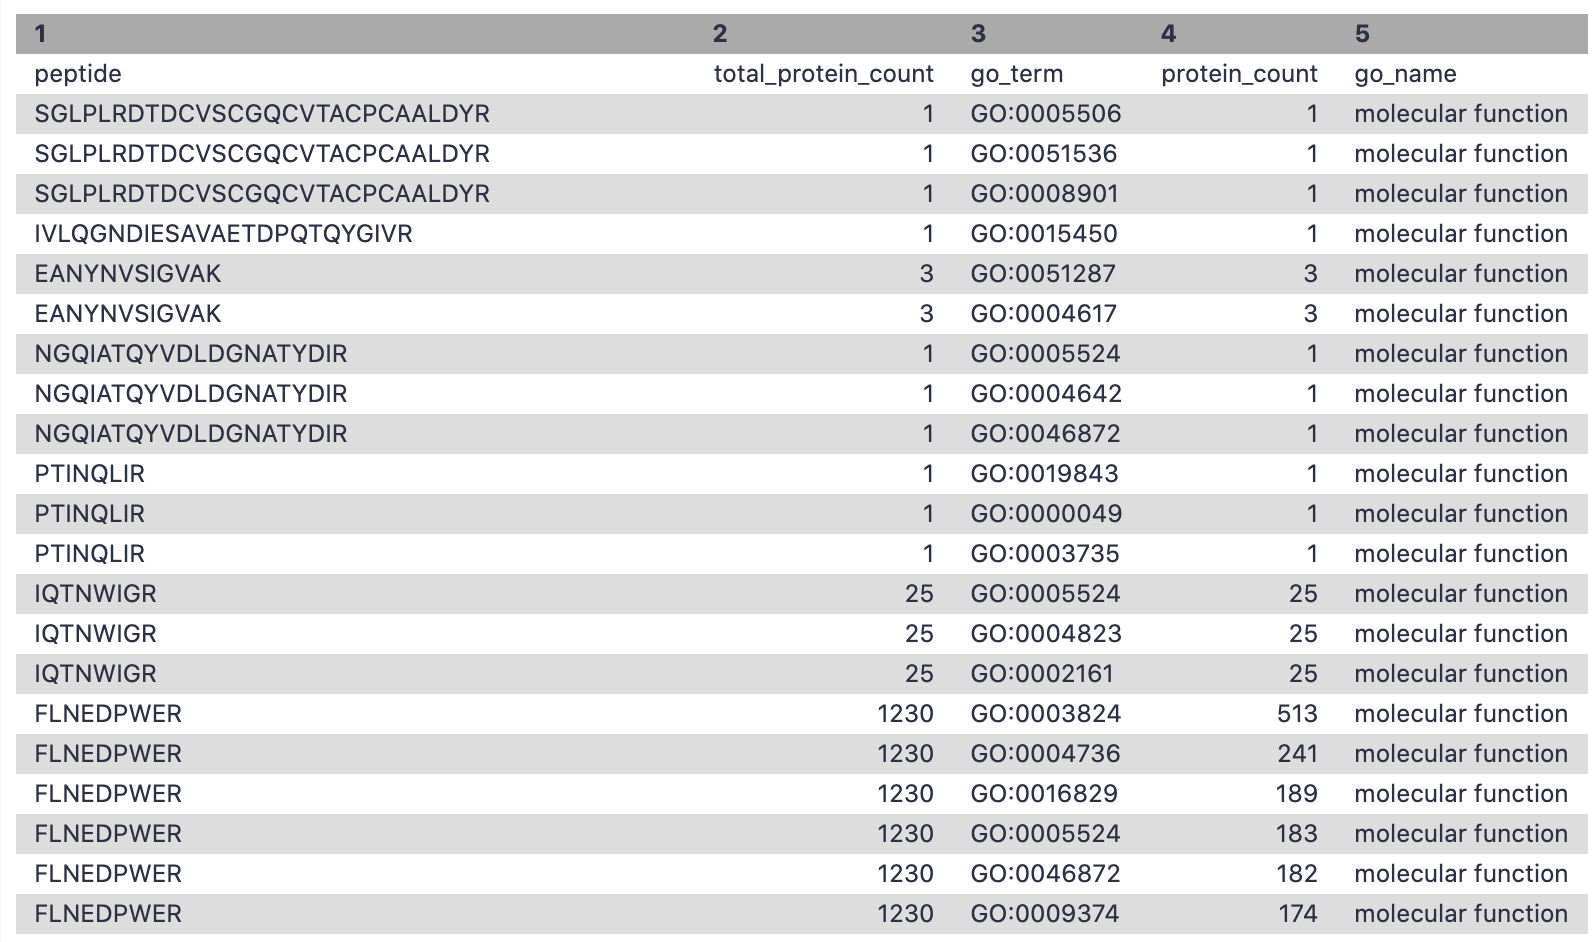
Filter - Molecular Function
This step is used to filter out the GO terms with molecular function and the corresponding number of peptides associated with these terms.
Hands On: Extracting molecular function for metaQuantome
Filter with the following parameters:
param-file“Filter”: Unipept_Function (output of Query Tabulartool)
“With following condition”: c5=='molecular function'
“Number of header lines to skip”: 1
Rename file as go_mf
Conclusion
This completes the walkthrough of the metaQuantome data creation workflow. This tutorial is a guide to have datasets that are metaQuantome ready/compatible and can be used for metaproteomics research. We have incorporated only two conditions in this workflow but users can use as many as they want. Researchers can use this workflow with their data also, please note that the tool parameters and the workflow will be needed to be modified accordingly.
This workflow was developed by the Galaxy-P team at the University of Minnesota. For more information about Galaxy-P or our ongoing work, please visit us at galaxyp.org
You've Finished the Tutorial
Please also consider filling out the Feedback Form as well!
Key points
Use dataset collections
With SearchGUI and PeptideShaker you can gain access to multiple search engines
Learning the basics of SQL queries can pay off
Frequently Asked Questions
Have questions about this tutorial? Have a look at the available FAQ pages and support channels
Further information, including links to documentation and original publications, regarding the tools, analysis techniques and the interpretation of results described in this tutorial can be found here.
Jagtap, P. D., A. Blakely, K. Murray, S. Stewart, J. Kooren et al., 2015 Metaproteomic analysis using the Galaxy framework. PROTEOMICS 15: 3553–3565. 10.1002/pmic.201500074
Mesuere, B., F. V. der Jeugt, T. Willems, T. Naessens, B. Devreese et al., 2018 High-throughput metaproteomics data analysis with Unipept: A tutorial. Journal of Proteomics 171: 11–22. 10.1016/j.jprot.2017.05.022
Easterly, C. W., R. Sajulga, S. Mehta, J. Johnson, P. Kumar et al., 2019 metaQuantome: An Integrated, Quantitative Metaproteomics Approach Reveals Connections Between Taxonomy and Protein Function in Complex Microbiomes. Molecular & Cellular Proteomics 18: S82–S91. 10.1074/mcp.ra118.001240
Did you use this material as an instructor? Feel free to give us feedback on how it went.
Did you use this material as a learner or student? Click the form below to leave feedback.
Hiltemann, Saskia, Rasche, Helena et al., 2023 Galaxy Training: A Powerful Framework for Teaching! PLOS Computational Biology 10.1371/journal.pcbi.1010752
Batut et al., 2018 Community-Driven Data Analysis Training for Biology Cell Systems 10.1016/j.cels.2018.05.012
@misc{proteomics-metaquantome-data-creation,
author = "Subina Mehta and Timothy J. Griffin and Pratik Jagtap and Emma Leith and Marie Crane",
	title = "metaQuantome 1: Data creation (Galaxy Training Materials)",
	year = "",
	month = "",
	day = "",
	url = "\url{https://training.galaxyproject.org/training-material/topics/proteomics/tutorials/metaquantome-data-creation/tutorial.html}",
	note = "[Online; accessed TODAY]"
}
@article{Hiltemann_2023,
	doi = {10.1371/journal.pcbi.1010752},
	url = {https://doi.org/10.1371%2Fjournal.pcbi.1010752},
	year = 2023,
	month = {jan},
	publisher = {Public Library of Science ({PLoS})},
	volume = {19},
	number = {1},
	pages = {e1010752},
	author = {Saskia Hiltemann and Helena Rasche and Simon Gladman and Hans-Rudolf Hotz and Delphine Larivi{\`{e}}re and Daniel Blankenberg and Pratik D. Jagtap and Thomas Wollmann and Anthony Bretaudeau and Nadia Gou{\'{e}} and Timothy J. Griffin and Coline Royaux and Yvan Le Bras and Subina Mehta and Anna Syme and Frederik Coppens and Bert Droesbeke and Nicola Soranzo and Wendi Bacon and Fotis Psomopoulos and Crist{\'{o}}bal Gallardo-Alba and John Davis and Melanie Christine Föll and Matthias Fahrner and Maria A. Doyle and Beatriz Serrano-Solano and Anne Claire Fouilloux and Peter van Heusden and Wolfgang Maier and Dave Clements and Florian Heyl and Björn Grüning and B{\'{e}}r{\'{e}}nice Batut and},
	editor = {Francis Ouellette},
	title = {Galaxy Training: A powerful framework for teaching!},
	journal = {PLoS Comput Biol}
}
Congratulations on successfully completing this tutorial!
Do you want to extend your knowledge?
Follow one of our recommended follow-up trainings:
Questions: