Neoantigen 5b: IEDB binding Validated Neopeptides
| Author(s) |
|
| Editor(s) |
|
| Reviewers |
|
OverviewQuestions:
Objectives:
What are neoantigens, and why are they significant in cancer immunotherapy?
How can binding predictions and validation help distinguish strong and weak binders?
What tools and techniques are commonly used for neoantigen identification and validation?
Requirements:
Understand the process of neoantigen identification and the role of peptide binding predictions.
Learn how to use IEDB to predict the binding affinity of peptides to MHC molecules.
Distinguish between strong and weak binders based on predicted binding affinity.
Time estimation: 3 hoursSupporting Materials:Published: Jan 14, 2025Last modification: Dec 3, 2025License: Tutorial Content is licensed under Creative Commons Attribution 4.0 International License. The GTN Framework is licensed under MITpurl PURL: https://gxy.io/GTN:T00542version Revision: 5
Neoantigens are peptides derived from tumor-specific mutations, which are recognized by the immune system as foreign and can stimulate an immune response against cancer cells. Identifying these neoantigens is a crucial step in the development of personalized cancer immunotherapies, as they serve as targets for T-cell mediated immune responses. However, predicting which peptides from the tumor genome will bind effectively to major histocompatibility complex (MHC) molecules—key proteins that present antigens to immune cells—remains a significant challenge.
This tutorial outlines a comprehensive workflow for the identification, prediction, and validation of potential neoantigens. We begin by using the Immune Epitope Database (IEDB) to predict the binding affinity of peptide sequences to MHC molecules. IEDB provides powerful tools to model how peptides interact with different MHC alleles, helping to prioritize peptides that are most likely to be presented by the immune system. Finally, we categorize the peptides into strong and weak binders, based on their predicted affinity, which helps in identifying the most promising candidates for cancer immunotherapy.
AgendaIn this tutorial, we will cover:
- Neoantigen HLA binding for Novel peptides
- Overview of HLA Binding Prediction for Potential Neoantigens
- Get data
- Predicting MHC Binding with IEDB
- Filtering Results Based on Affinity
- Peptide Annotation Using FASTA-to-Tabular
- Refining Results Using Table Operations
- Identifying Weak Neopeptides (SQLite Query)
- Identifying Strong Neopeptides (SQLite Query)
- Annotation of Strong and Weak Binder Peptides
- Conclusion
- Rerunning on your own data
- Are you feeling adventurous? ✨
- Disclaimer
Neoantigen HLA binding for Novel peptides
Overview of HLA Binding Prediction for Potential Neoantigens
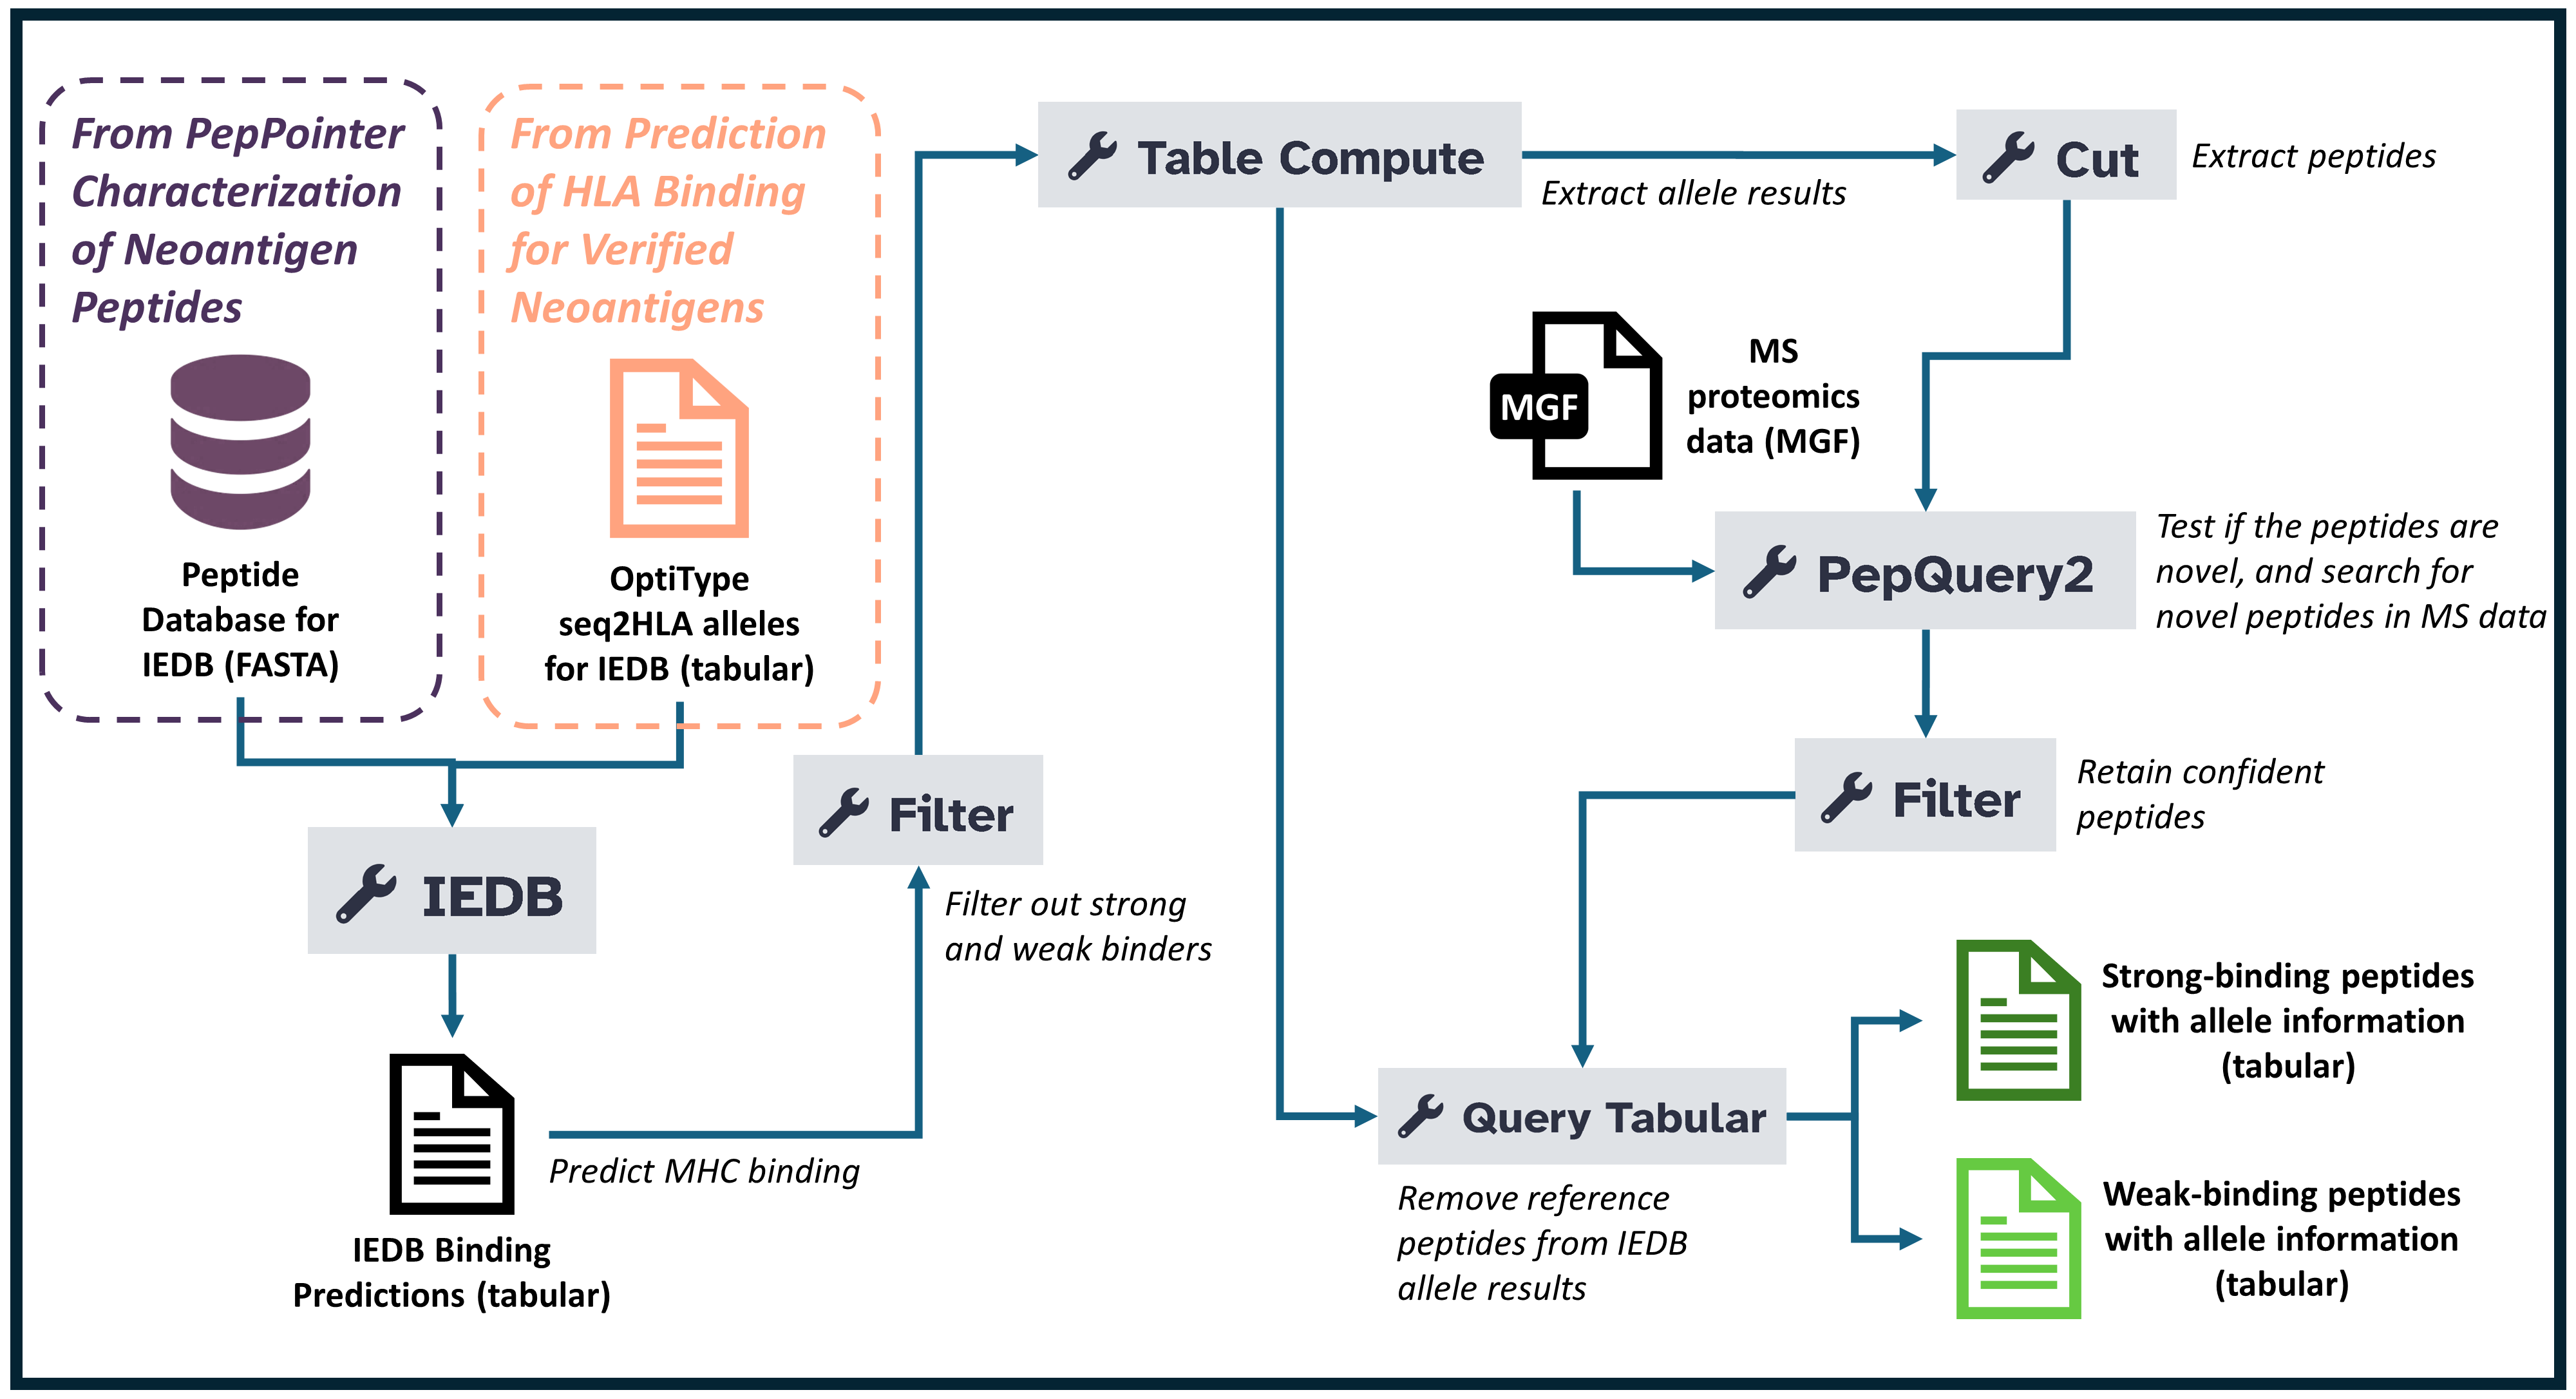
This workflow outlines a structured approach to predicting and analyzing peptide-HLA (MHC-I) binding affinities, focusing on neoantigens for immunotherapy. Here’s an overview of the workflow, broken into key steps:
- Get Data The first step involves gathering and uploading the necessary proteomics data files into the analysis environment. These files typically contain protein sequences or raw spectrum data that will be processed throughout the tutorial. Proper data organization and tagging are essential to ensure smooth workflow execution.
- Predicting MHC Binding with IEDB In this step, the goal is to predict how peptide sequences will bind to MHC-I molecules, an essential part of identifying potential neoantigens. The IEDB tool is launched with parameters such as prediction method (netmhcpan_el), selecting relevant alleles, and uploading peptide sequences in FASTA format.
- Filtering Results Based on Affinity Once the MHC-I binding affinities are predicted, it’s time to filter the results based on specific criteria to narrow down the most promising peptides.The peptides are categorized into strong and weak binders: an affinity value of less than 0.5 is a strong binder, while a value between 0.5 and 2 is a weak binder.
- Refining Results Using Table Operations To further refine the results, the data is aggregated, focusing on the highest-ranked peptides based on various parameters like affinity and percent rank. This tool is used to aggregate data and perform operations such as selecting the highest-ranking peptides based on specified criteria (e.g., using a pivot operation).
- Filtering and annotating peptide binding affinity to HLA. In this step, the peptides are filtered to focus on those that exhibit strong evidence of binding affinity to Human Leukocyte Antigen (HLA) molecules. This process involves filtering and annotating these peptides and narrows down the most promising candidates for further investigation, ensuring that only those with reliable peptide-HLA interactions are considered for potential clinical or research applications. This step is critical for identifying peptides with the potential to serve as targets for immunotherapy or vaccine development.
Get data
Hands On: Data Upload
- Create a new history for this tutorial
Import the files from Zenodo or from the shared data library (
GTN - Material->proteomics->Neoantigen 5b: IEDB binding Validated Neopeptides):https://zenodo.org/records/14377365/files/FASTA-IEDB.fasta https://zenodo.org/records/14377365/files/IEDB-Optitype-seq2HLA-alleles.tabular
- Copy the link location
Click galaxy-upload Upload at the top of the activity panel
- Select galaxy-wf-edit Paste/Fetch Data
Paste the link(s) into the text field
Press Start
- Close the window
As an alternative to uploading the data from a URL or your computer, the files may also have been made available from a shared data library:
- Go into Libraries (left panel)
- Navigate to the correct folder as indicated by your instructor.
- On most Galaxies tutorial data will be provided in a folder named GTN - Material –> Topic Name -> Tutorial Name.
- Select the desired files
- Click on Add to History galaxy-dropdown near the top and select as Datasets from the dropdown menu
In the pop-up window, choose
- “Select history”: the history you want to import the data to (or create a new one)
- Click on Import
- Rename the datasets
Check that the datatype
- Click on the galaxy-pencil pencil icon for the dataset to edit its attributes
- In the central panel, click galaxy-chart-select-data Datatypes tab on the top
- In the galaxy-chart-select-data Assign Datatype, select
datatypesfrom “New Type” dropdown
- Tip: you can start typing the datatype into the field to filter the dropdown menu
- Click the Save button
Add to each database a tag corresponding to …
Datasets can be tagged. This simplifies the tracking of datasets across the Galaxy interface. Tags can contain any combination of letters or numbers but cannot contain spaces.
To tag a dataset:
- Click on the dataset to expand it
- Click on Add Tags galaxy-tags
- Add tag text. Tags starting with
#will be automatically propagated to the outputs of tools using this dataset (see below).- Press Enter
- Check that the tag appears below the dataset name
Tags beginning with
#are special!They are called Name tags. The unique feature of these tags is that they propagate: if a dataset is labelled with a name tag, all derivatives (children) of this dataset will automatically inherit this tag (see below). The figure below explains why this is so useful. Consider the following analysis (numbers in parenthesis correspond to dataset numbers in the figure below):
- a set of forward and reverse reads (datasets 1 and 2) is mapped against a reference using Bowtie2 generating dataset 3;
- dataset 3 is used to calculate read coverage using BedTools Genome Coverage separately for
+and-strands. This generates two datasets (4 and 5 for plus and minus, respectively);- datasets 4 and 5 are used as inputs to Macs2 broadCall datasets generating datasets 6 and 8;
- datasets 6 and 8 are intersected with coordinates of genes (dataset 9) using BedTools Intersect generating datasets 10 and 11.
Now consider that this analysis is done without name tags. This is shown on the left side of the figure. It is hard to trace which datasets contain “plus” data versus “minus” data. For example, does dataset 10 contain “plus” data or “minus” data? Probably “minus” but are you sure? In the case of a small history like the one shown here, it is possible to trace this manually but as the size of a history grows it will become very challenging.
The right side of the figure shows exactly the same analysis, but using name tags. When the analysis was conducted datasets 4 and 5 were tagged with
#plusand#minus, respectively. When they were used as inputs to Macs2 resulting datasets 6 and 8 automatically inherited them and so on… As a result it is straightforward to trace both branches (plus and minus) of this analysis.More information is in a dedicated #nametag tutorial.


Predicting MHC Binding with IEDB
In this step of the workflow, the IEDB (Immune Epitope Database) tool is used to predict peptide binding to MHC-I molecules, which is crucial for identifying potential neoantigens. This is accomplished by using the netmhcpan_el prediction method to analyze peptide sequences and their binding affinity to specific MHC alleles. The netmhcpan_el method is a state-of-the-art tool that predicts how likely a peptide sequence is to bind to a given MHC-I allele. The alleles to be tested against are selected from a history file, ensuring that the analysis is tailored to specific genetic variations. Peptides that are predicted to bind MHC-I molecules are provided in a FASTA format, which is the standard for representing protein sequences. The IEDB tool is integral in neoantigen discovery because it allows researchers to identify which peptides (out of many potential candidates) have a high likelihood of binding to MHC-I molecules. These peptides are of interest as they could trigger an immune response against cancer cells or pathogens, making them candidates for immunotherapy.
Hands On: IEDB
- IEDB ( Galaxy version 2.15.2) with the following parameters:
- “Prediction”:
MHC-I Binding
- “prediction method”:
netmhcpan_el- “Alleles”:
From history
- param-file “Alleles file”:
IEDB-Optitype-seq2HLA-alleles.tabular(Input dataset)- “peptide lengths for prediction”:
89101112- “Peptide sequences”:
Fasta file
- param-file “Peptide Sequence Fasta”:
FASTA-IEDB.fasta(Input dataset)
Question
- Why do I need to specify the netmhcpan_el method for peptide-MHC binding prediction?
- What should I do if my peptide sequence file is not in the correct FASTA format?
- The netmhcpan_el method is a highly accurate and widely used algorithm for predicting peptide binding to MHC-I molecules. By specifying this method, you’re ensuring that the prediction is based on a well-established and reliable tool, increasing the likelihood of accurate results for identifying potential neoantigens.
- If your peptide sequence file is not in the FASTA format, you’ll need to reformat the file before uploading it to the IEDB tool. FASTA format is a plain text format used to represent nucleotide or peptide sequences, where each sequence begins with a > symbol followed by a description line and then the sequence itself. Many bioinformatics tools, including IEDB, require this format to interpret the sequences correctly.
Filtering Results Based on Affinity
In this step, the Filter tool is used to refine the results from the previous IEDB step by selecting peptides based on their binding affinity to MHC-I molecules. Peptides are categorized into separate groups based on their binding affinities, with those that bind with lower or higher affinity being filtered accordingly. We utilize the affinity values to identify strong and weak binders. Specifically, peptides with an affinity value greater than 0.5 and less than or equal to 2 are classified as weak binders, while those with an affinity value less than 0.5 are classified as strong binders. This distinction is important, as peptides with very low or extremely high affinities may be as relevant for further analysis.
CommentPlease make sure the inputs and outputs of the weak and strong binders processing steps are well labeled to avoid any confusion.
Hands On: Filter weak binders
- Filter with the following parameters:
- param-file “Filter”:
output(output of IEDB tool)- “With following condition”:
c11>0.5 and c11<=2- “Number of header lines to skip”:
1
Hands On: Filter strong binders
- Filter with the following parameters:
- param-file “Filter”:
output(output of IEDB tool)- “With following condition”:
c11<=0.5- “Number of header lines to skip”:
1
Question
- Why do we need to filter strong and weak binder?
- Filtering weak and strong binders is crucial for optimizing the identification of peptides that bind to MHC-I molecules with an optimal affinity, which is key for selecting potential neoantigens. Weak binders (with affinities greater than 0.5 but less than or equal to 2) are less likely to trigger a robust immune response, while strong binders (with affinities less than or equal to 0.5) might bind too tightly, potentially causing inefficient or excessive immune reactions. By filtering both extremes, the analysis focuses on peptides with moderate affinity that are more likely to stimulate an effective immune response without causing adverse effects. This targeted filtering not only enhances the relevance of the peptides for therapeutic applications but also improves the quality of predictions by reducing the inclusion of ineffective or irrelevant peptides, ultimately increasing the chances of identifying candidates suitable for vaccine development or immunotherapy.
Peptide Annotation Using FASTA-to-Tabular
The FASTA-to-Tabular converter transforms peptide FASTA sequences into a tabular format that is easier to filter, join, and annotate. This step is commonly used before submitting peptides to annotation tools such as for database lookups.
Hands On: Peptide annotation
- FASTA-to-Tabular ( Galaxy version 1.1.1) with the following parameters:
- param-file “Convert these sequences” → the peptide FASTA file
- “How many columns to divide title string into?”:
1- “How many title characters to keep?”:
0This tool converts the peptide FASTA into a structured tabular format, preserving full header information in a single column. The resulting table provides clean sequence identifiers that can be linked to genomic, variant, and immunological metadata in later steps.
Question
- Why do we keep the entire FASTA title string as a single column?
- How does converting FASTA to tabular format support downstream annotation workflows (e.g., HLA binding, variant mapping, epitope analysis)?
- A single-column title ensures that peptide identifiers remain intact and can be reliably matched across tools that expect exact header strings—especially important for workflows combining genomics and proteomics metadata.
- Many annotation tools require tabular inputs. Converting FASTA to tabular enables joins, filtering, SQL-based queries, and integration with peptide-centric metadata (variant origin, binding scores, validation status, etc.), allowing seamless downstream analysis.
Refining Results Using Table Operations
Pivoting the table to aggregate affinity scores
In this step, the Table Compute tool is used to refine and aggregate the data from the filtered MHC-I peptide binding results. Specifically, the tool is performing a Pivot operation, which transforms the data for easier analysis and interpretation. The tool organizes the data by a specific index, such as icore, which could represent a unique identifier or a feature of interest in the dataset. The column to be analyzed is allele, which groups the data by different alleles (i.e., the genetic variants of the MHC molecules). The values of interest, which represent the binding affinity scores or ranks (e.g., percentile_rank), are then aggregated using the Maximum function, ensuring that for each group of alleles, the highest binding affinity is retained.
This operation is important because it helps prioritize the peptides that exhibit the strongest binding potential for each allele. By focusing on the best binders per allele, the data becomes more manageable and relevant for further analysis, such as identifying the most promising neoantigen candidates.
This Table Compute tool is used to perform a data manipulation operation called Pivot. This operation transforms the table format and aggregates data based on specific parameters to provide clearer insights. Specifically:
- The Index is set to icore, which could refer to a specific identifier or feature within the dataset. This helps group the data by this particular attribute.
- The Column parameter is set to allele, so the data will be organized based on different alleles of the MHC molecules, grouping them accordingly.
- The Values being analyzed are the percentile_rank, which represent the binding affinities of the peptides.
- The Aggregator Function is set to Maximum, meaning that for each allele, only the highest binding affinity (best percentile rank) is retained in the output.
Hands On: Weak-Table Compute
- Table Compute ( Galaxy version 1.2.4+galaxy0) with the following parameters:
- “Input Single or Multiple Tables”:
Single Table
- param-file “Table”:
out_file1(output of Filter tool)- “Type of table operation”:
Perform a full table operation
- “Operation”:
Pivot
- “Index”:
icore- “Column”:
allele- “Values”:
percentile_rank- “Aggregator Function”:
Maximum- Rename file as “IEDB Binding Affinity - Weak Peptides”.
Identifying Weak Neopeptides (SQLite Query)
The Query Tabular (using sqlite sql) tool extracts identifiers for weak-binding or otherwise filtered neopeptides from a tabular/SQLite-backed dataset. This step can be used to pull peptide IDs for downstream HLA-binding review, reporting, or separate IEDB-based workflows.
Hands On: Weak peptides and HLA binding
- Query Tabular: sqlite sql ( Galaxy version 3.3.2) with the following parameters:
- param-file “Tabular Dataset for Table” (table1):
Peptide Annotation(output of FASTA-to-Tabular)- param-file “Tabular Dataset for Table” (table2):
IEDB Binding Affinity - Weak Peptides(output of Table Compute - Weak peptides)- “Save the sqlite database in your history”:
Yes- “SQL Query to generate tabular output”:
SELECT t2.* FROM t1 JOIN t2 ON t1.c2 = t2.icore- Run the query to obtain a deduplicated, ordered list of weak-binding peptide identifiers for downstream review or submission to IEDB/HLA pipelines.
Hands On: Weak-binding neopeptides
- Query Tabular: sqlite sql ( Galaxy version 3.3.2) with the following parameters:
- param-file “Tabular Dataset for Table” (table):
peptide_table_for_sql(output of Query Tabular - Weak peptides)- “Save the sqlite database in your history”:
Yes- “SQL Query to generate tabular output”:
SELECT t1.icore FROM t1 ORDER BY t1.icore- Run the query to obtain a deduplicated, ordered list of weak-binding peptide identifiers for downstream review or submission to IEDB/HLA pipelines.
Question
- What is the purpose of extracting
icorein this query?- How can the output of this step be used in an IEDB workflow?
icoretypically represents a canonical peptide identifier used to join HLA-binding results with peptide metadata; extracting it enables targeted follow-up.- The list can be used to submit only weak-binding or candidate peptides to separate IEDB prediction workflows or for manual curation and reporting.
Hands On: Strong-Table Compute
- Table Compute ( Galaxy version 1.2.4+galaxy0) with the following parameters:
- “Input Single or Multiple Tables”:
Single Table
- param-file “Table”:
out_file1(output of Filter tool)- “Type of table operation”:
Perform a full table operation
- “Operation”:
Pivot
- “Index”:
icore- “Column”:
allele- “Values”:
percentile_rank- “Aggregator Function”:
Maximum- Rename file as “IEDB Binding Affinity - Strong Peptides”.
Identifying Strong Neopeptides (SQLite Query)
The Query Tabular (using sqlite sql) tool extracts identifiers for strong-binding or otherwise filtered neopeptides from a tabular/SQLite-backed dataset. This step can be used to pull peptide IDs for downstream HLA-binding review, reporting, or separate IEDB-based workflows.
Hands On: Strong peptides and HLA binding
- Query Tabular: sqlite sql ( Galaxy version 3.3.2) with the following parameters:
- param-file “Tabular Dataset for Table” (table1):
Peptide Annotation(output of FASTA-to-Tabular)- param-file “Tabular Dataset for Table” (table2):
IEDB Binding Affinity - Strong Peptides(output of Table Compute - Strong peptides)- “Save the sqlite database in your history”:
Yes- “SQL Query to generate tabular output”:
SELECT t2.* FROM t1 JOIN t2 ON t1.c2 = t2.icore- Run the query to obtain a deduplicated, ordered list of strong-binding peptide identifiers for downstream review or submission to IEDB/HLA pipelines.
Hands On: Strong-binding neopeptides
- Query Tabular: sqlite sql ( Galaxy version 3.3.2) with the following parameters:
- param-file “Tabular Dataset for Table” (table):
peptide_table_for_sql(output of Query Tabular - Strong peptides)- “Save the sqlite database in your history”:
Yes- “SQL Query to generate tabular output”:
SELECT t1.icore FROM t1 ORDER BY t1.icore- Run the query to obtain a deduplicated, ordered list of strong-binding peptide identifiers for downstream review or submission to IEDB/HLA pipelines.
Question
- Why is the Pivot operation used in this step?
- Why do we use the ‘Maximum’ aggregator function?
- The Pivot operation is used to reorganize the data so that each allele is associated with the highest percentile rank (maximum value) for the peptides. This helps in focusing on the top-ranked peptides for each allele, ensuring that the analysis highlights the most promising candidates for immunotherapy or vaccine development.
- The ‘Maximum’ function ensures that, for each allele, we keep the peptide with the highest binding affinity (best percentile rank). This step prioritizes the most relevant peptides for further analysis, eliminating lower-affinity binders that are less likely to have therapeutic potential.
Annotation of Strong and Weak Binder Peptides
The annotation of strong and weak binders tells you how well peptides interact with Human Leukocyte Antigen (HLA) molecules, which is important for understanding their potential role in immune responses, especially in the context of immunotherapy and vaccine development.
Here’s what the annotations mean:
1. Strong Binder Peptides:
- These peptides have high binding affinity to the HLA molecules.
- Peptides that bind strongly to HLA molecules are more likely to be presented to T-cells, which is a crucial step in eliciting an immune response.
- Strong binder peptides are often the focus of vaccine development and cancer immunotherapy because they are more likely to activate the immune system effectively.
- The annotation of strong binders can help identify peptides that are more likely to stimulate immune responses and be used in the development of treatments for diseases like cancer or infections.
2. Weak Binder Peptides:
- These peptides have low binding affinity to the HLA molecules.
- Peptides that bind weakly to HLA are less likely to be presented to T-cells and may not elicit a strong immune response.
- Weak binder peptides are generally not prioritized for immunotherapy applications, though they can still be of interest in understanding immune evasion or identifying potential targets that may require further optimization for stronger binding.
Why the Annotation Matters:
- Differentiating Strong and Weak Binders helps you prioritize which peptides are more likely to be effective in stimulating an immune response.
- This classification is useful for:
- Designing vaccines or immunotherapies that can generate a strong and specific immune response.
- Understanding immune system interactions with peptides from pathogens or tumor cells.
- Identifying biomarkers that can be used in diagnostics or therapeutic monitoring.
Conclusion
The ability to predict and validate neoantigens is a cornerstone of modern cancer immunotherapy, particularly in personalized immunotherapies such as cancer vaccines and adoptive T-cell therapies. The identification of high-affinity neoantigens, which can effectively stimulate the immune system, is key to developing therapeutic strategies that selectively target tumor cells while sparing healthy tissue.
This workflow is particularly relevant in the neoantigen discovery process, as it combines computational prediction with experimental validation, ensuring that only the most promising peptides are considered for therapeutic development. By integrating IEDB’s predictive capabilities, this workflow bridges the gap between in silico predictions and in vitro experimental data, allowing for a more robust and reliable neoantigen identification pipeline. Separating peptides into strong and weak binders based on their predicted MHC affinity further refines the selection process, ensuring that high-priority candidates are prioritized for downstream therapeutic application.
Given the increasing demand for personalized cancer treatments, this workflow represents a vital approach for accelerating the identification of clinically relevant neoantigens, thus advancing the field of cancer immunotherapy and personalized medicine.
The outputs from the iPepGen workflow, specifically the HLA allele genotypes and verified neoantigen candidate peptide sequences, serve as input to the pVACbind software suite, which we deployed as a Galaxy tool. pVACbind is part of the personalized Variant Antigens in Cancer tool suite (pVACtools). The pVACbind software bundles numerous complementary tools for predicting binding of input peptide sequences to HLA protein complexes (both class I and II) coded by specific allele genotypes, as well as two deep learning algorithms, DeepImmuno and BigMHC, for predicting immunogenicity of HLA alleles and bound peptides. The Galaxy tool outputs a tabular file with aggregated results across all of the algorithms selected by the user, as well as a filtered output showing only those peptide and allele combination scores indicating high potential for immunogenicity. The (pVACbind)[https://pvactools.readthedocs.io/en/latest/pvacbind.html] software is well documented and provides users with ample information about the bundled tools and how to interpret results for assisting in prioritizing peptides for further experimental testing as immunotherapy agents.

Rerunning on your own data
To rerun this entire analysis at once, you can use our workflow. If users encounter failed tools and/or workflows, we recommend that users review that the appropriate inputs are selected before re-running.
Below we show how to do this:
Hands On: Running the Workflow
- Import the workflow into Galaxy:
- Run Workflow workflow using the following parameters:
- “Send results to a new history”:
No- param-file “Distinct HLA alleles (can be from OptiType and seq2HLA)”:
IEDB-Optitype-seq2HLA-alleles.tabular- param-file “FASTA file of peptides to test for HLA binding (can be from Arriba)”:
FASTA-IEDB.fasta
- Click on Workflows on the Activity Bar on the left.
- At the top of the resulting page you will have the option to switch between the My workflows, Workflows shared with me and Public workflows tabs.
- Select the tab you want to see all workflows in that category
Search for your desired workflow.
- Click on the workflow name: a pop-up window opens with a preview of the workflow.
- To run it directly: click Run (top-right).
- Recommended: click Import (left of Run) to make your own local copy under Workflows / My Workflows.
Comment: DISCLAIMER
- If any step in this workflow fails, please ensure that the input files have been correctly generated and formatted by the preceding tools. Workflow failures often result from improperly called or incomplete input data rather than errors in the workflow itself. Users are responsible for verifying their input before troubleshooting workflow issues.

Are you feeling adventurous? ✨
One-Click Neoantigen Workflow
This new One-Click Neoantigen Workflow brings together all key modules of the neoantigen discovery process into a single, streamlined analysis within Galaxy. Instead of launching each tutorial separately, users can now execute the entire end-to-end pipeline—from database creation to HLA binding prediction—with just one click —without ever leaving Galaxy.
Disclaimer
Please note that all the software tools used in this workflow are subject to version updates and changes. As a result, the parameters, functionalities, and outcomes may differ with each new version. Additionally, if the protein sequences are downloaded at different times, the number of sequences may also vary due to updates in the reference databases or tool modifications. We recommend the users to verify the specific versions of software tools used to ensure the reproducibility and accuracy of results.
You've Finished the Tutorial
Key points
Neoantigens are crucial targets for cancer immunotherapy, with their binding strength to MHC molecules playing a critical role in immune response.
IEDB allows for the prediction of peptide-MHC binding affinities, helping to identify candidate neoantigens.
Separating strong and weak binders allows for prioritization in therapeutic applications.
Frequently Asked Questions
Have questions about this tutorial? Have a look at the available FAQ pages and support channelsUseful literature
Further information, including links to documentation and original publications, regarding the tools, analysis techniques and the interpretation of results described in this tutorial can be found here.
Feedback
Did you use this material as an instructor? Feel free to give us feedback on how it went.
Did you use this material as a learner or student? Click the form below to leave feedback.

Citing this Tutorial
- Subina Mehta, Katherine Do, James Johnson, Neoantigen 5b: IEDB binding Validated Neopeptides (Galaxy Training Materials). https://training.galaxyproject.org/training-material/topics/proteomics/tutorials/neoantigen-hla-binding-novel-peptides/tutorial.html Online; accessed TODAY
- Hiltemann, Saskia, Rasche, Helena et al., 2023 Galaxy Training: A Powerful Framework for Teaching! PLOS Computational Biology 10.1371/journal.pcbi.1010752
- Batut et al., 2018 Community-Driven Data Analysis Training for Biology Cell Systems 10.1016/j.cels.2018.05.012
Congratulations on successfully completing this tutorial!@misc{proteomics-neoantigen-hla-binding-novel-peptides, author = "Subina Mehta and Katherine Do and James Johnson", title = "Neoantigen 5b: IEDB binding Validated Neopeptides (Galaxy Training Materials)", year = "", month = "", day = "", url = "\url{https://training.galaxyproject.org/training-material/topics/proteomics/tutorials/neoantigen-hla-binding-novel-peptides/tutorial.html}", note = "[Online; accessed TODAY]" } @article{Hiltemann_2023, doi = {10.1371/journal.pcbi.1010752}, url = {https://doi.org/10.1371%2Fjournal.pcbi.1010752}, year = 2023, month = {jan}, publisher = {Public Library of Science ({PLoS})}, volume = {19}, number = {1}, pages = {e1010752}, author = {Saskia Hiltemann and Helena Rasche and Simon Gladman and Hans-Rudolf Hotz and Delphine Larivi{\`{e}}re and Daniel Blankenberg and Pratik D. Jagtap and Thomas Wollmann and Anthony Bretaudeau and Nadia Gou{\'{e}} and Timothy J. Griffin and Coline Royaux and Yvan Le Bras and Subina Mehta and Anna Syme and Frederik Coppens and Bert Droesbeke and Nicola Soranzo and Wendi Bacon and Fotis Psomopoulos and Crist{\'{o}}bal Gallardo-Alba and John Davis and Melanie Christine Föll and Matthias Fahrner and Maria A. Doyle and Beatriz Serrano-Solano and Anne Claire Fouilloux and Peter van Heusden and Wolfgang Maier and Dave Clements and Florian Heyl and Björn Grüning and B{\'{e}}r{\'{e}}nice Batut and}, editor = {Francis Ouellette}, title = {Galaxy Training: A powerful framework for teaching!}, journal = {PLoS Comput Biol} }
You can use Ephemeris's
shed-tools installcommand to install the tools used in this tutorial.shed-tools install [-g GALAXY] [-a API_KEY] -t <(curl https://training.galaxyproject.org/training-material/api/topics/proteomics/tutorials/neoantigen-hla-binding-novel-peptides/tutorial.json | jq .admin_install_yaml -r)Alternatively you can copy and paste the following YAML
---
install_tool_dependencies: true
install_repository_dependencies: true
install_resolver_dependencies: true
tools:
- name: iedb_api
  owner: iuc
  revisions: 7ed6dda64a81
  tool_panel_section_label: Get Data
  tool_shed_url: https://toolshed.g2.bx.psu.edu/
- name: table_compute
  owner: iuc
  revisions: 3bf5661c0280
  tool_panel_section_label: Text Manipulation
  tool_shed_url: https://toolshed.g2.bx.psu.edu/