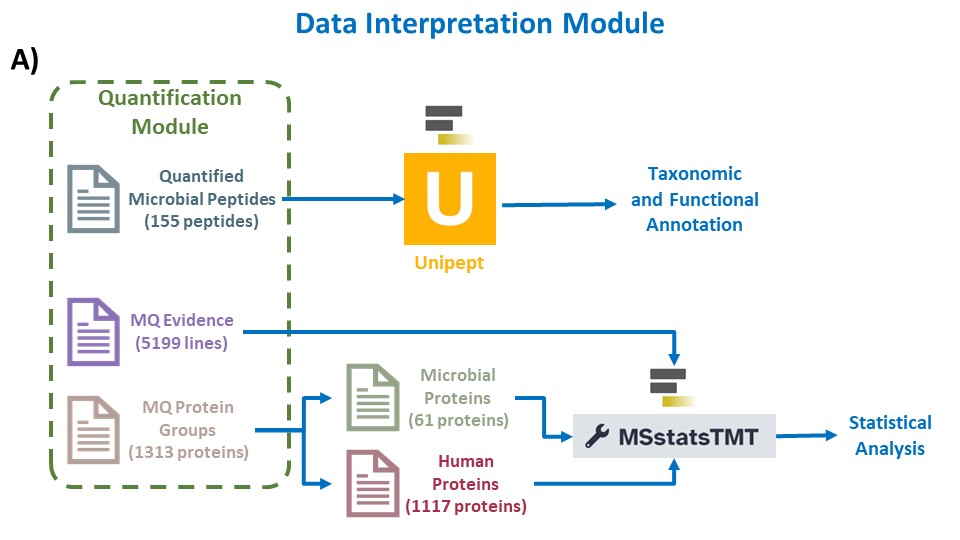
The final workflow in the array of clinical metaproteomics tutorials is the data interpretation workflow. Interpreting MaxQuant data using MSstats involves applying a rigorous statistical framework to glean meaningful insights from quantitative proteomic datasets. The MaxQuant output is explored to understand data distribution and variability. Subsequent normalization helps account for systematic variations. MSstats allows the user to define the experimental design, including sample groups and conditions, to perform statistical analysis. The output provides valuable information about differential protein expression across conditions, estimates of fold changes, and associated p-values, aiding in the identification of biologically significant proteins. Furthermore, MSstats enables quality control and data visualization, ultimately enhancing our ability to draw meaningful conclusions from complex proteomic datasets. Additional tutorial material for using MaxQuant and MSstatTMT for TMT data analysis can be found at MaxQuant and MSstats for the analysis of TMT data.
Click galaxy-uploadUpload at the top of the activity panel
Select galaxy-wf-editPaste/Fetch Data
Paste the link(s) into the text field
Press Start
Close the window
As an alternative to uploading the data from a URL or your computer, the files may also have been made available from a shared data library:
Go into Libraries (left panel)
Navigate to the correct folder as indicated by your instructor.
On most Galaxies tutorial data will be provided in a folder named GTN - Material –> Topic Name -> Tutorial Name.
Select the desired files
Click on Add to Historygalaxy-dropdown near the top and select as Datasets from the dropdown menu
In the pop-up window, choose
“Select history”: the history you want to import the data to (or create a new one)
Click on Import
Rename the datasets
Check that the datatype
Click on the galaxy-pencilpencil icon for the dataset to edit its attributes
In the central panel, click galaxy-chart-select-dataDatatypes tab on the top
In the galaxy-chart-select-dataAssign Datatype, select datatypes from “New Type” dropdown
Tip: you can start typing the datatype into the field to filter the dropdown menu
Click the Save button
Add to each database a tag corresponding to …
Datasets can be tagged. This simplifies the tracking of datasets across the Galaxy interface. Tags can contain any combination of letters or numbers but cannot contain spaces.
To tag a dataset:
Click on the dataset to expand it
Click on Add Tagsgalaxy-tags
Add tag text. Tags starting with # will be automatically propagated to the outputs of tools using this dataset (see below).
Press Enter
Check that the tag appears below the dataset name
Tags beginning with # are special!
They are called Name tags. The unique feature of these tags is that they propagate: if a dataset is labelled with a name tag, all derivatives (children) of this dataset will automatically inherit this tag (see below). The figure below explains why this is so useful. Consider the following analysis (numbers in parenthesis correspond to dataset numbers in the figure below):
a set of forward and reverse reads (datasets 1 and 2) is mapped against a reference using Bowtie2 generating dataset 3;
dataset 3 is used to calculate read coverage using BedTools Genome Coverageseparately for + and - strands. This generates two datasets (4 and 5 for plus and minus, respectively);
datasets 4 and 5 are used as inputs to Macs2 broadCall datasets generating datasets 6 and 8;
datasets 6 and 8 are intersected with coordinates of genes (dataset 9) using BedTools Intersect generating datasets 10 and 11.
Now consider that this analysis is done without name tags. This is shown on the left side of the figure. It is hard to trace which datasets contain “plus” data versus “minus” data. For example, does dataset 10 contain “plus” data or “minus” data? Probably “minus” but are you sure? In the case of a small history like the one shown here, it is possible to trace this manually but as the size of a history grows it will become very challenging.
The right side of the figure shows exactly the same analysis, but using name tags. When the analysis was conducted datasets 4 and 5 were tagged with #plus and #minus, respectively. When they were used as inputs to Macs2 resulting datasets 6 and 8 automatically inherited them and so on… As a result it is straightforward to trace both branches (plus and minus) of this analysis.
Click on galaxy-workflows-activityWorkflows in the Galaxy activity bar (on the left side of the screen, or in the top menu bar of older Galaxy instances). You will see a list of all your workflows
Click on galaxy-uploadImport at the top-right of the screen
Paste the following URL into the box labelled “Archived Workflow URL”: https://training.galaxyproject.org/training-material/topics/proteomics/tutorials/clinical-mp-5-data-interpretation/workflows/WF5_Data_Interpretation_Worklow.ga
Click the Import workflow button
Below is a short video demonstrating how to import a workflow from GitHub using this procedure:
Video: Importing a workflow from URL
Run Workflowworkflow using the following parameters:
Click on Workflows on the Activity Bar on the left.
At the top of the resulting page you will have the option to switch between the My workflows, Workflows shared with me and Public workflows tabs.
Select the tab you want to see all workflows in that category
Search for your desired workflow.
Click on the workflow name: a pop-up window opens with a preview of the workflow.
To run it directly: click Run (top-right).
Recommended: click Import (left of Run) to make your own local copy under Workflows / My Workflows.
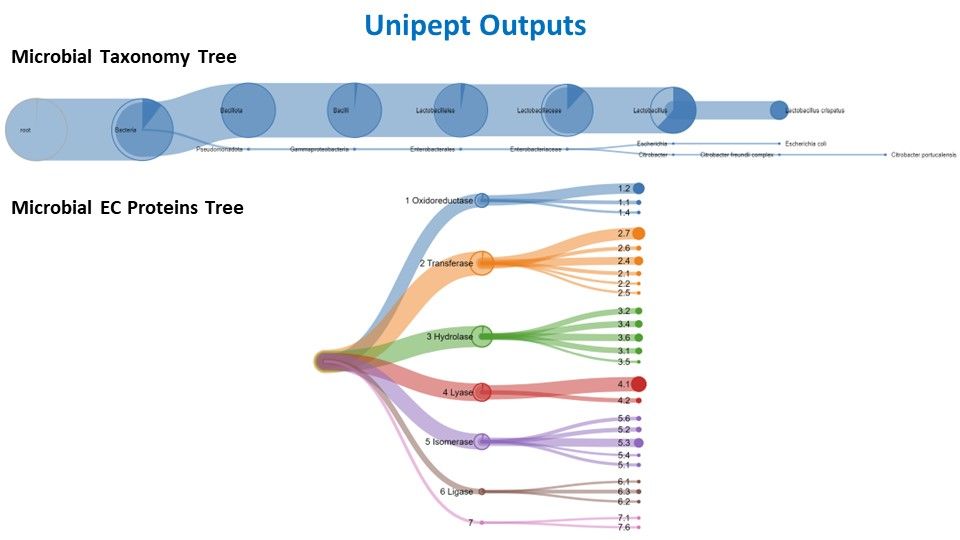
Taxonomic analysis with Unipept
Unipept serves as a vital bioinformatics platform for the analysis of mass spectrometry-based shotgun proteomics data, especially in the study of microbial communities. Its primary utility lies in taxonomic and functional analyses, enabling researchers to identify and quantify microorganisms within diverse environments. The platform facilitates comparative studies across samples, conditions, or time points, shedding light on the dynamic responses of microbial communities to environmental changes. Unipept integrates with public databases like UniProt, ensuring access to comprehensive and updated information for annotations. Being community-driven and open source, Unipept fosters collaboration and transparency, with a user-friendly web interface that accommodates researchers of varying bioinformatics expertise. In essence, Unipept is an invaluable resource, offering tools for the exploration of metaproteomic data and contributing to advancements in our understanding of microbial ecology.
Hands On: Unipept 5.0
Unipept ( Galaxy version 4.5.1) with the following parameters:
“Unipept application”: peptinfo: Tryptic peptides and associated EC and GO terms and lowest common ancestor taxonomy
“Match input peptides by”: Match to the full input peptide
“Choose outputs”: Tabular with one line per peptideJSON Taxomony TreePeptide GO terms in normalized tabularPeptide InterPro entries in normalized tabularPeptide EC terms in normalized tabularJSON EC Coverage Tree
param-file“Select lines from”: out_file1 (output of Selecttool)
“that”: NOT Matching
“the pattern”: (_REVERSED)|(REV_)|(CON)|(con)
“Keep header line”: Yes
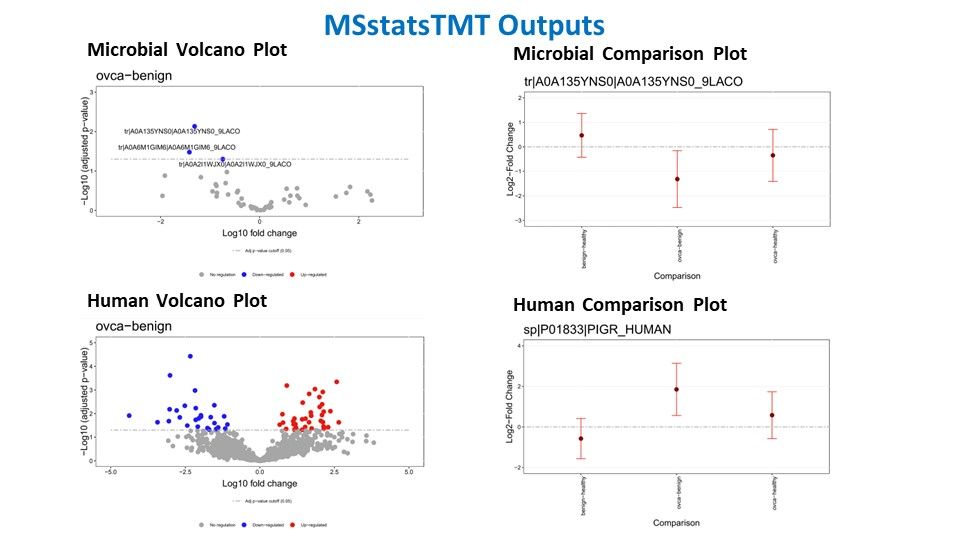
MSstats TMT
MSstats TMT(Tandem Mass Tag) is a computational tool designed for the robust statistical analysis of mass spectrometry-based quantitative proteomics data using TMT labeling. TMT is a widely used method for multiplexed quantitative proteomics, enabling simultaneous identification and quantification of proteins across multiple samples. MSstats TMT plays a crucial role in this process by providing a statistical framework for analyzing TMT data, and facilitating accurate and reliable protein abundance measurements. The tool offers a range of features, including quality control, normalization, and statistical modeling, allowing researchers to identify differentially expressed proteins with confidence. MSstats TMT is particularly valuable in large-scale studies where quantifying protein expression across multiple conditions is essential for understanding complex biological processes. Its application contributes to advancing our understanding of proteomic changes in response to various experimental conditions or perturbations.
Statistical Analysis of Microbial proteins with MSstatsTMT
Hands On: MSstatsTMT
MSstatsTMT ( Galaxy version 2.0.0+galaxy1) with the following parameters:
The MSstats output typically includes essential information such as estimated fold changes, p-values, and other statistical measures that help identify differentially expressed proteins across experimental conditions or sample groups. It provides a clear picture of the variations in protein expression levels, aiding in the prioritization of biologically relevant targets. MSstats output also often includes visualizations and quality control metrics, making it a valuable resource for researchers in their quest to extract meaningful insights from complex proteomic datasets and understand the underlying biology of their experiments.
Example of our data interpretation:
Conclusion
With the completion of this tutorial, you have successfully completed the clinical metaproteomics tutorials.
In conclusion, clinical metaproteomics tutorials represent an essential gateway to harnessing the power of advanced proteomic techniques in the realm of clinical research and applications. These bioinformatics tutorials serve as valuable guides for understanding the intricacies of metaproteomic workflows, from data analysis to interpretation. By providing comprehensive knowledge and practical insights, they equip researchers and clinicians with the tools necessary to explore the rich diversity of the microbiome and its impact on health and disease or environment. As metaproteomic techniques continue to evolve and integrate with clinical practice, we hope these tutorials will be instrumental in shaping clinical research.
You've Finished the Tutorial
Please also consider filling out the Feedback Form as well!
Key points
Data interpretation and visualization of clinical samples.
Frequently Asked Questions
Have questions about this tutorial? Have a look at the available FAQ pages and support channels
Further information, including links to documentation and original publications, regarding the tools, analysis techniques and the interpretation of results described in this tutorial can be found here.
Feedback
Did you use this material as an instructor? Feel free to give us feedback on how it went.
Did you use this material as a learner or student? Click the form below to leave feedback.
Hiltemann, Saskia, Rasche, Helena et al., 2023 Galaxy Training: A Powerful Framework for Teaching! PLOS Computational Biology 10.1371/journal.pcbi.1010752
Batut et al., 2018 Community-Driven Data Analysis Training for Biology Cell Systems 10.1016/j.cels.2018.05.012
@misc{proteomics-clinical-mp-5-data-interpretation,
author = "Subina Mehta and Katherine Do and Dechen Bhuming",
	title = "Clinical Metaproteomics 5: Data Interpretation (Galaxy Training Materials)",
	year = "",
	month = "",
	day = "",
	url = "\url{https://training.galaxyproject.org/training-material/topics/proteomics/tutorials/clinical-mp-5-data-interpretation/tutorial.html}",
	note = "[Online; accessed TODAY]"
}
@article{Hiltemann_2023,
	doi = {10.1371/journal.pcbi.1010752},
	url = {https://doi.org/10.1371%2Fjournal.pcbi.1010752},
	year = 2023,
	month = {jan},
	publisher = {Public Library of Science ({PLoS})},
	volume = {19},
	number = {1},
	pages = {e1010752},
	author = {Saskia Hiltemann and Helena Rasche and Simon Gladman and Hans-Rudolf Hotz and Delphine Larivi{\`{e}}re and Daniel Blankenberg and Pratik D. Jagtap and Thomas Wollmann and Anthony Bretaudeau and Nadia Gou{\'{e}} and Timothy J. Griffin and Coline Royaux and Yvan Le Bras and Subina Mehta and Anna Syme and Frederik Coppens and Bert Droesbeke and Nicola Soranzo and Wendi Bacon and Fotis Psomopoulos and Crist{\'{o}}bal Gallardo-Alba and John Davis and Melanie Christine Föll and Matthias Fahrner and Maria A. Doyle and Beatriz Serrano-Solano and Anne Claire Fouilloux and Peter van Heusden and Wolfgang Maier and Dave Clements and Florian Heyl and Björn Grüning and B{\'{e}}r{\'{e}}nice Batut and},
	editor = {Francis Ouellette},
	title = {Galaxy Training: A powerful framework for teaching!},
	journal = {PLoS Comput Biol}
}
Congratulations on successfully completing this tutorial!
Do you want to extend your knowledge?
Follow one of our recommended follow-up trainings:
Questions: