Very Short Introductions: QC
Under Development!
This tutorial is not in its final state. The content may change a lot in the next months. Because of this status, it is also not listed in the topic pages.
| Author(s) |
|
| Reviewers |
|
OverviewQuestions:
Objectives:
How do I know my sequencing data is good?
Learn about QCing Illumina and Element data
Learn about fastp
Learn about multiqc
Time estimation: 30 minutesSupporting Materials:Published: Mar 26, 2024Last modification: Jun 25, 2024License: Tutorial Content is licensed under Creative Commons Attribution 4.0 International License. The GTN Framework is licensed under MITpurl PURL: https://gxy.io/GTN:T00436version Revision: 4
In this tutorial we will look at assessing quality of data from two short read technologies: Illumina and Element Biosciences.
AgendaIn this tutorial, we will cover:
FASTQ format
FASTQ is not a very well defined format. In the beginning various manufacturers of sequencing instruments were free to interpret FASTQ as they saw fit, resulting in a multitude of FASTQ flavors. This variation stemmed primarily from different ways of encoding quality values as described on the Wikipedia article for FASTQ (below you will find an explanation of quality scores and their meaning). Today, the FASTQ Sanger version of the format is considered to be the standard form of FASTQ. Galaxy is using FASTQ Sanger as the only legitimate input for downstream processing tools and provides a number of utilities for converting FASTQ files into this form (see FASTQ Quality Control section of Galaxy tools).
The FASTQ format looks like this:
@M02286:19:000000000-AA549:1:1101:12677:1273 1:N:0:23
CCTACGGGTGGCAGCAGTGAGGAATATTGGTCAATGGACGGAAGTCTGAACCAGCCAAGTAGCGTGCAG
+
ABC8C,:@F:CE8,B-,C,-6-9-C,CE9-CC--C-<-C++,,+;CE<,,CD,CEFC,@E9<FCFCF?9
@M02286:19:000000000-AA549:1:1101:15048:1299 1:N:0:23
CCTACGGGTGGCTGCAGTGAGGAATATTGGACAATGGTCGGAAGACTGATCCAGCCATGCCGCGTGCAG
+
ABC@CC77CFCEG;F9<F89<9--C,CE,--C-6C-,CE:++7:,CF<,CEF,CFGGD8FFCFCFEGCF
@M02286:19:000000000-AA549:1:1101:11116:1322 1:N:0:23
CCTACGGGAGGCAGCAGTAGGGAATCTTCGGCAATGGACGGAAGTCTGACCGAGCAACGCCGCGTGAGT
+
AAC<CCF+@@>CC,C9,F9C9@9-CFFFE@7@:+CC8-C@:7,@EFE,6CF:+8F7EFEEF@EGGGEEE
Each sequencing read is represented by four lines:
@followed by read ID and optional information about sequencing run- sequenced bases
+(optionally followed by the read ID and some additional info)- quality scores for each base of the sequence encoded as ASCII symbols
Paired end data
It is common to prepare pair-end and mate-pair sequencing libraries. This is highly beneficial for a number of applications discussed in subsequent topics. For now let’s just briefly discuss what these are and how they manifest themselves in FASTQ form.
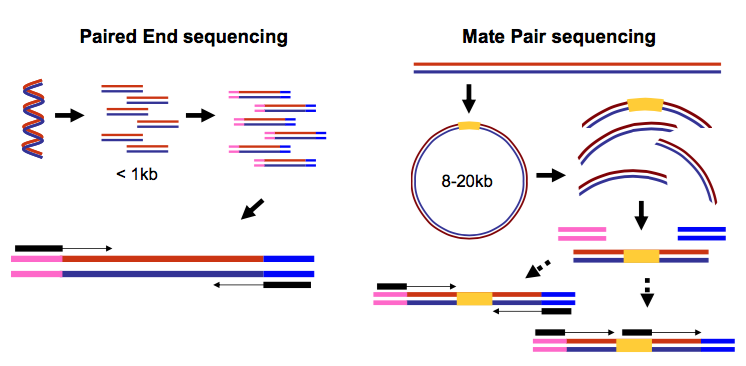 Open image in new tab
Thus in both cases (paired-end and mate-pair) a single physical piece of DNA (or RNA in the case of RNA-seq) is sequenced from two ends and so generates two reads. These can be represented as separate files (two FASTQ files with first and second reads) or a single file were reads for each end are interleaved. Here are examples:
Two single files
File 1
 @M02286:19:000000000-AA549:1:1101:12677:1273 1:N:0:23
 CCTACGGGTGGCAGCAGTGAGGAATATTGGTCAATGGACGGAAGTCT
 +
 ABC8C,:@F:CE8,B-,C,-6-9-C,CE9-CC--C-<-C++,,+;CE
 @M02286:19:000000000-AA549:1:1101:15048:1299 1:N:0:23
 CCTACGGGTGGCTGCAGTGAGGAATATTGGACAATGGTCGGAAGACT
 +
 ABC@CC77CFCEG;F9<F89<9--C,CE,--C-6C-,CE:++7:,CF
File 2
@M02286:19:000000000-AA549:1:1101:12677:1273 2:N:0:23
CACTACCCGTGTATCTAATCCTGTTTGATACCCGCACCTTCGAGCTTA
+
--8A,CCE+,,;,<CC,,<CE@,CFD,,C,CFF+@+@CCEF,,,B+C,
@M02286:19:000000000-AA549:1:1101:15048:1299 2:N:0:23
CACTACCGGGGTATCTAATCCTGTTCGCTCCCCACGCTTTCGTCCATC
+
-6AC,EE@::CF7CFF<<FFGGDFFF,@FGGGG?F7FEGGGDEFF>FF
Comment: Read order is importantNote that read IDs are identical in two files and they are listed in the same order. In some cases read IDs in the first and second file may be appended with
/1and/2tags, respectively.
Interleaved file
@1/1
AGGGATGTGTTAGGGTTAGGGTTAGGGTTAGGGTTAGGGTTAGGGTTA
+
EGGEGGGDFGEEEAEECGDEGGFEEGEFGBEEDDECFEFDD@CDD<ED
@1/2
CCTAACCCTAACCCTAACCCTAACCCTAACCCTAACCCTAACCCTAAC
+
GHHHDFDFGFGEGFBGEGGEGEGGGHGFGHFHFHHHHHHHEF?EFEFF
@2/1
AGGGATGTGTTAGGGTTAGGGTTAGGGTTAGGGTTAGGGTTAGGGTTA
+
HHHHHHEGFHEEFEEHEEHHGGEGGGGEFGFGGGGHHHHFBEEEEEFG
@2/2
CCTAACCCTAACCCTAACCCTAACCCTAACCCTAACCCTAACCCTAAC
+
HHHHHHHHHHHHHGHHHHHHGHHHHHHHHHHHFHHHFHHHHHHHHHHH
Here the first and the second reads are identified with /1 and /2 tags.
Comment: FASTQ format is a loose standardFASTQ format is not strictly defined and its variations will always cause headache for you. See this page for more information.
What are base qualities?
As we’ve seen above, FASTQ datasets contain two types of information:
- sequence of the read
- base qualities for each nucleotide in the read.
The base qualities allow us to judge how trustworthy each base in a sequencing read is. The following excerpt from an excellent tutorial by Friederike Dündar, Luce Skrabanek, Paul Zumbo explains what base qualities are:
Comment: From "Introduction to differential gene expression analysis using RNA-seq"Illumina sequencing is based on identifying the individual nucleotides by the fluorescence signal emitted upon their incorporation into the growing sequencing read. Once the fluorescence intensities are extracted and translated into the four letter code. The deduction of nucleotide sequences from the images acquired during sequencing is commonly referred to as base calling.
Due to the imperfect nature of the sequencing process and limitations of the optical instruments, base calling will always have inherent uncertainty. This is the reason why FASTQ files store the DNA sequence of each read together with a position-specific quality score that represents the error probability, i.e., how likely it is that an individual base call may be incorrect. The score is called Phred score, \(Q\), which is proportional to the probability \(p\) that a base call is incorrect, where \(Q = −10lg(p)\). For example, a Phred score of 10 corresponds to one error in every ten base calls (\(Q = −10lg(0.1)\)), or 90% accuracy; a Phred score of 20 corresponds to one error in every 100 base calls, or 99% accuracy. A higher Phred score thus reflects higher confidence in the reported base.
To assign each base a unique score identifier (instead of numbers of varying character length), Phred scores are typically represented as ASCII characters. At http://ascii-code.com/ you can see which characters are assigned to what number.
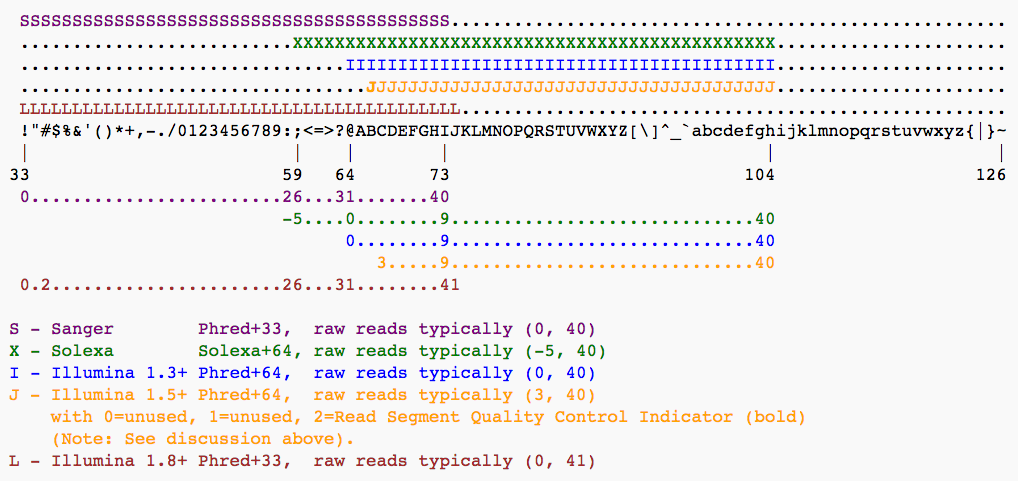
For raw reads, the range of scores will depend on the sequencing technology and the base caller used (Illumina, for example, used a tool called Bustard, or, more recently, RTA). Unfortunately, Illumina has been anything but consistent in how they calculated and ASCII-encoded the Phred score (see below)! In addition, Illumina now allows Phred scores for base calls with as high as 45, while 41 used to be the maximum score until the HiSeq X. This may cause issues with downstream sapplications that expect an upper limit of 41.
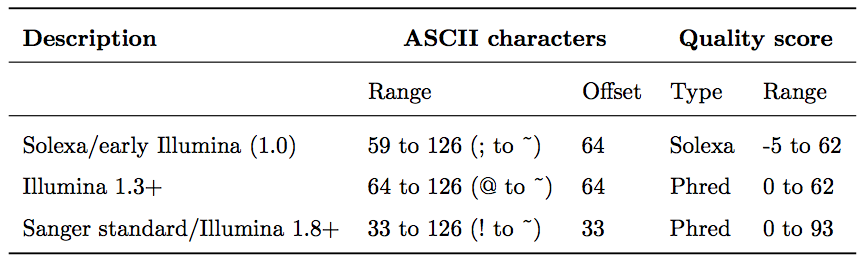 Open image in new tab
Base call quality scores are represented with the Phred range. Different Illumina (formerly Solexa) versions used different scores and ASCII offsets. Starting with Illumina format 1.8, the score now represents the standard Sanger/Phred format that is also used by other sequencing platforms and the sequencing archives.
 Open image in new tab
Assessing quality
This tutorial provides two sample datasets: one generated with Illumina and the other with ElemBio (AVITI) machine. Pick any. We will compare qualities of the two platforms at the and of this tutorial.
Get data
Hands On: Data Upload
Create a new history for this tutorial
To create a new history simply click the new-history icon at the top of the history panel:
Import the files from Zenodo:
Element (AVITI). This datasets contains forward (r1) and reverse (r2) reads for two samples—
s1ands2:https://zenodo.org/records/10870107/files/elem_s1_r1.fq.gz https://zenodo.org/records/10870107/files/elem_s1_r2.fq.gz https://zenodo.org/records/10870107/files/elem_s2_r1.fq.gz https://zenodo.org/records/10870107/files/elem_s2_r2.fq.gzIllumina. This datasets contains forward (_1) and reverse (_2) reads for two samples—
blandch:https://zenodo.org/record/5119008/files/M117-bl_1.fq.gz https://zenodo.org/record/5119008/files/M117-bl_2.fq.gz https://zenodo.org/record/5119008/files/M117-ch_1.fq.gz https://zenodo.org/record/5119008/files/M117-ch_2.fq.gz
- Copy the link location
Click galaxy-upload Upload at the top of the activity panel
- Select galaxy-wf-edit Paste/Fetch Data
Paste the link(s) into the text field
Press Start
- Close the window
Check that the datatype is set to
fastqsanger.gz(Galaxy usually automatically assigns the right datatype, but check anyway).
- Click on the galaxy-pencil pencil icon for the dataset to edit its attributes
- In the central panel, click galaxy-chart-select-data Datatypes tab on the top
- In the galaxy-chart-select-data Assign Datatype, select
datatypesfrom “New Type” dropdown
- Tip: you can start typing the datatype into the field to filter the dropdown menu
- Click the Save button
Create a paired collection from your data (relevant part beging at 0:57 and and the case of this tutorial we have 4 datasets):


Assess quality and clean the reads with fastp
fastp is fast utility for computing read qualities and performing initial clean up of the data such as adapter removal.
Hands On: Running `fastp`
- fastp ( Galaxy version 0.23.2+galaxy0) with the following parameters:
- “Single-end or paired reads”:
Paired Collection
- param-collection “Select paired collection(s)”:
output(Input dataset collection)- In “Output Options”:
- “Output JSON report”:
Yes
Sub-step with MultiQC[]
multiqc is a report generation tool. It can process outputs on multiple tools including fastp:
Hands On: Generating quality report
- MultiQC ( Galaxy version 1.11+galaxy1) with the following parameters:
- In “Results”:
- param-repeat “Insert Results”
- “Which tool was used generate logs?”:
fastp
- param-file “Output of fastp”:
report_json(output of fastp tool)
Interpreting the results
The comparison between Element and Illumina QC plot is shown below:
Both datasets are exceptionally good. However, the elemnt data has even higher quality.
Conclusion
Now you can easily evaluate quality of your own data in Galaxy!
You've Finished the Tutorial
Key points
Galaxy is an excellent tool for quickly QCing your data
Frequently Asked Questions
Have questions about this tutorial? Have a look at the available FAQ pages and support channelsFeedback
Did you use this material as an instructor? Feel free to give us feedback on how it went.
Did you use this material as a learner or student? Click the form below to leave feedback.

Citing this Tutorial
- Anton Nekrutenko, Very Short Introductions: QC (Galaxy Training Materials). https://training.galaxyproject.org/training-material/topics/introduction/tutorials/vsi_qc/tutorial.html Online; accessed TODAY
- Hiltemann, Saskia, Rasche, Helena et al., 2023 Galaxy Training: A Powerful Framework for Teaching! PLOS Computational Biology 10.1371/journal.pcbi.1010752
- Batut et al., 2018 Community-Driven Data Analysis Training for Biology Cell Systems 10.1016/j.cels.2018.05.012
Congratulations on successfully completing this tutorial!@misc{introduction-vsi_qc, author = "Anton Nekrutenko", title = "Very Short Introductions: QC (Galaxy Training Materials)", year = "", month = "", day = "", url = "\url{https://training.galaxyproject.org/training-material/topics/introduction/tutorials/vsi_qc/tutorial.html}", note = "[Online; accessed TODAY]" } @article{Hiltemann_2023, doi = {10.1371/journal.pcbi.1010752}, url = {https://doi.org/10.1371%2Fjournal.pcbi.1010752}, year = 2023, month = {jan}, publisher = {Public Library of Science ({PLoS})}, volume = {19}, number = {1}, pages = {e1010752}, author = {Saskia Hiltemann and Helena Rasche and Simon Gladman and Hans-Rudolf Hotz and Delphine Larivi{\`{e}}re and Daniel Blankenberg and Pratik D. Jagtap and Thomas Wollmann and Anthony Bretaudeau and Nadia Gou{\'{e}} and Timothy J. Griffin and Coline Royaux and Yvan Le Bras and Subina Mehta and Anna Syme and Frederik Coppens and Bert Droesbeke and Nicola Soranzo and Wendi Bacon and Fotis Psomopoulos and Crist{\'{o}}bal Gallardo-Alba and John Davis and Melanie Christine Föll and Matthias Fahrner and Maria A. Doyle and Beatriz Serrano-Solano and Anne Claire Fouilloux and Peter van Heusden and Wolfgang Maier and Dave Clements and Florian Heyl and Björn Grüning and B{\'{e}}r{\'{e}}nice Batut and}, editor = {Francis Ouellette}, title = {Galaxy Training: A powerful framework for teaching!}, journal = {PLoS Comput Biol} }
You can use Ephemeris's
shed-tools installcommand to install the tools used in this tutorial.shed-tools install [-g GALAXY] [-a API_KEY] -t <(curl https://training.galaxyproject.org/training-material/api/topics/introduction/tutorials/vsi_qc/tutorial.json | jq .admin_install_yaml -r)Alternatively you can copy and paste the following YAML
---
install_tool_dependencies: true
install_repository_dependencies: true
install_resolver_dependencies: true
tools:
- name: fastp
  owner: iuc
  revisions: 65b93b623c77
  tool_panel_section_label: FASTA/FASTQ
  tool_shed_url: https://toolshed.g2.bx.psu.edu/
- name: multiqc
  owner: iuc
  revisions: abfd8a6544d7
  tool_panel_section_label: Quality Control
  tool_shed_url: https://toolshed.g2.bx.psu.edu/