The life science community is generally very good at sharing omics data on platforms such as GEO and ArrayExpress. However, the metadata and clinical data associated with the omics datasets are often incredibly sparse. Tracking down the meta- and clinical data of omics datasets can be time-consuming for both data owner and researcher and is a significant hurdle when trying to explore enriched omics data.
In this tutorial, you will learn the benefits of making clinical datasets FAIR (Findable, Accessible, Interoperable, and Reusable) and how to make them FAIR.
Hands On: How would you describe what are clinical datasets? - time 2 minutes - Silent reflection
consider in general terms
consider more specifically
In general, the most common clinical data used in research are clinical reports (from trials and observational studies) and individual patient data. In this section, we will explore some of the different types of clinical data.
Metadata that accompanies transcriptomic data
In GEO and ArrayExpress the elements that we are describing as clinical data are the Characteristics or Source Characteristics.
Hands On: Explore GEO and ArrayExpress for characteristics - time 5 minutes
Click on the link below for ArrayExpress and open the section for Source Characteristics ArrayExpress
Take a look at the Experimental Factors. Notice that there are very few characteristics available for this dataset.
Under the Samples section, click on one of the healthy controls. Here you will see that this dataset has many characteristics. Notice, however
that there is not much information gathered on the healthy controls
Click on one of the samples with systemic lupus erythematosus (SLE). Notice here that there is more data collected on SLE subjects.
Explore ArrayExpress and/or GEO for datasets within the domain(s) that you are familiar with. Take note of the availability of characteristic data for the different datasets
Interventional clinical trials
In these trials, usually, the participants have a condition or disease, and the research question is related to the effectiveness of a treatment. Some of the participants are given the treatment(s) under investigation, and the other participants are given either a placebo or non-treatment drug. Usually, these are under double-blind conditions, both participant and doctor do not know whether they are receiving/dispensing treatment or a placebo. In addition, there may also be a set of control participants who do not have the condition or disease. Data is usually collected at baseline or screening before any treatment or placebo is given, and then at least one time point in the future. The breadth and type of data collected can vary across trials, and this can be limiting when trying to pool data from different trials. The data collected could be minimal, with basic metadata to accompany the sample or imagining data. But the data collection could also could be quite extensive, including quality of life questionnaires filled out by the patient.
An example of an interventional clinical trial is TRACTISS, where the aim of the study was to establish whether the drug rituximab improves clinical outcomes for Primary Sjögren’s Syndrome patients.
Observational clinical trials
In these trials, data is collected at least once, there may not be a follow-up collection. The research question is usually related directly to the disease or condition, for example, understanding the biomarkers of a disease. As with interventional clinical trials, the breadth of data collected varies on the trial. There is often a control group but not always.
PRECISEADS is an example of an observational clinical trial where the study’s aim is molecular reclassification to find clinically useful biomarkers for systemic autoimmune diseases.
Registries
Registries usually record (over a period of time), the disease progression of patients with the same disease or condition. Often referred to a hub/collection point once the diagnosis is confirmed. Patients are continually added to the registries and therefore registries can provide a large pool of patients with relatively similar data collected. As these are registries of patients with a particular condition, there are no control participants.
Here are links to two registry projects. Both websites describe the projects, the aims and the outputs of the studies.
These are generally the data collected when a person has contact with the health services. In England, this can be quite fragmented, as each service provider (i.e. GP, hospital, social care, etc.) collects data as an individual organisation, using one of a number of accredited packages for collecting and storing electronic health records.
There are strict controls for researchers applying to access this data. The research purpose must be approved before access is given, and the researchers usually receive data relevant to their research question. In addition, the data received is usually anonymised to avoid the ability to identify individuals from the data.
In the UK, Clinical Practice Research Datalink (CPRD) collects anonymised patient data from a network of GP practices links this data to a range of other health-related data and provides a longitudinal, representative UK population health dataset.
The Health Data Research Innovation Gateway can help researchers to find and discover UK health datasets, tools and other resources to further health research.
Hands On: Explore HDRUK Innovation Gateway for datasets - time 5 minutes
In the filters, expand Publisher and in Search Filter type CPRD and enter
Select CPRD
Expand Phenotype and search for rheumatoid, and select Rheumatoid Arthritis
Take a look at the information about the two datasets
Clear the filters, and search for datasets related to your areas of interest
The importance of making clinical datasets FAIR
Associations between clinical features and omics
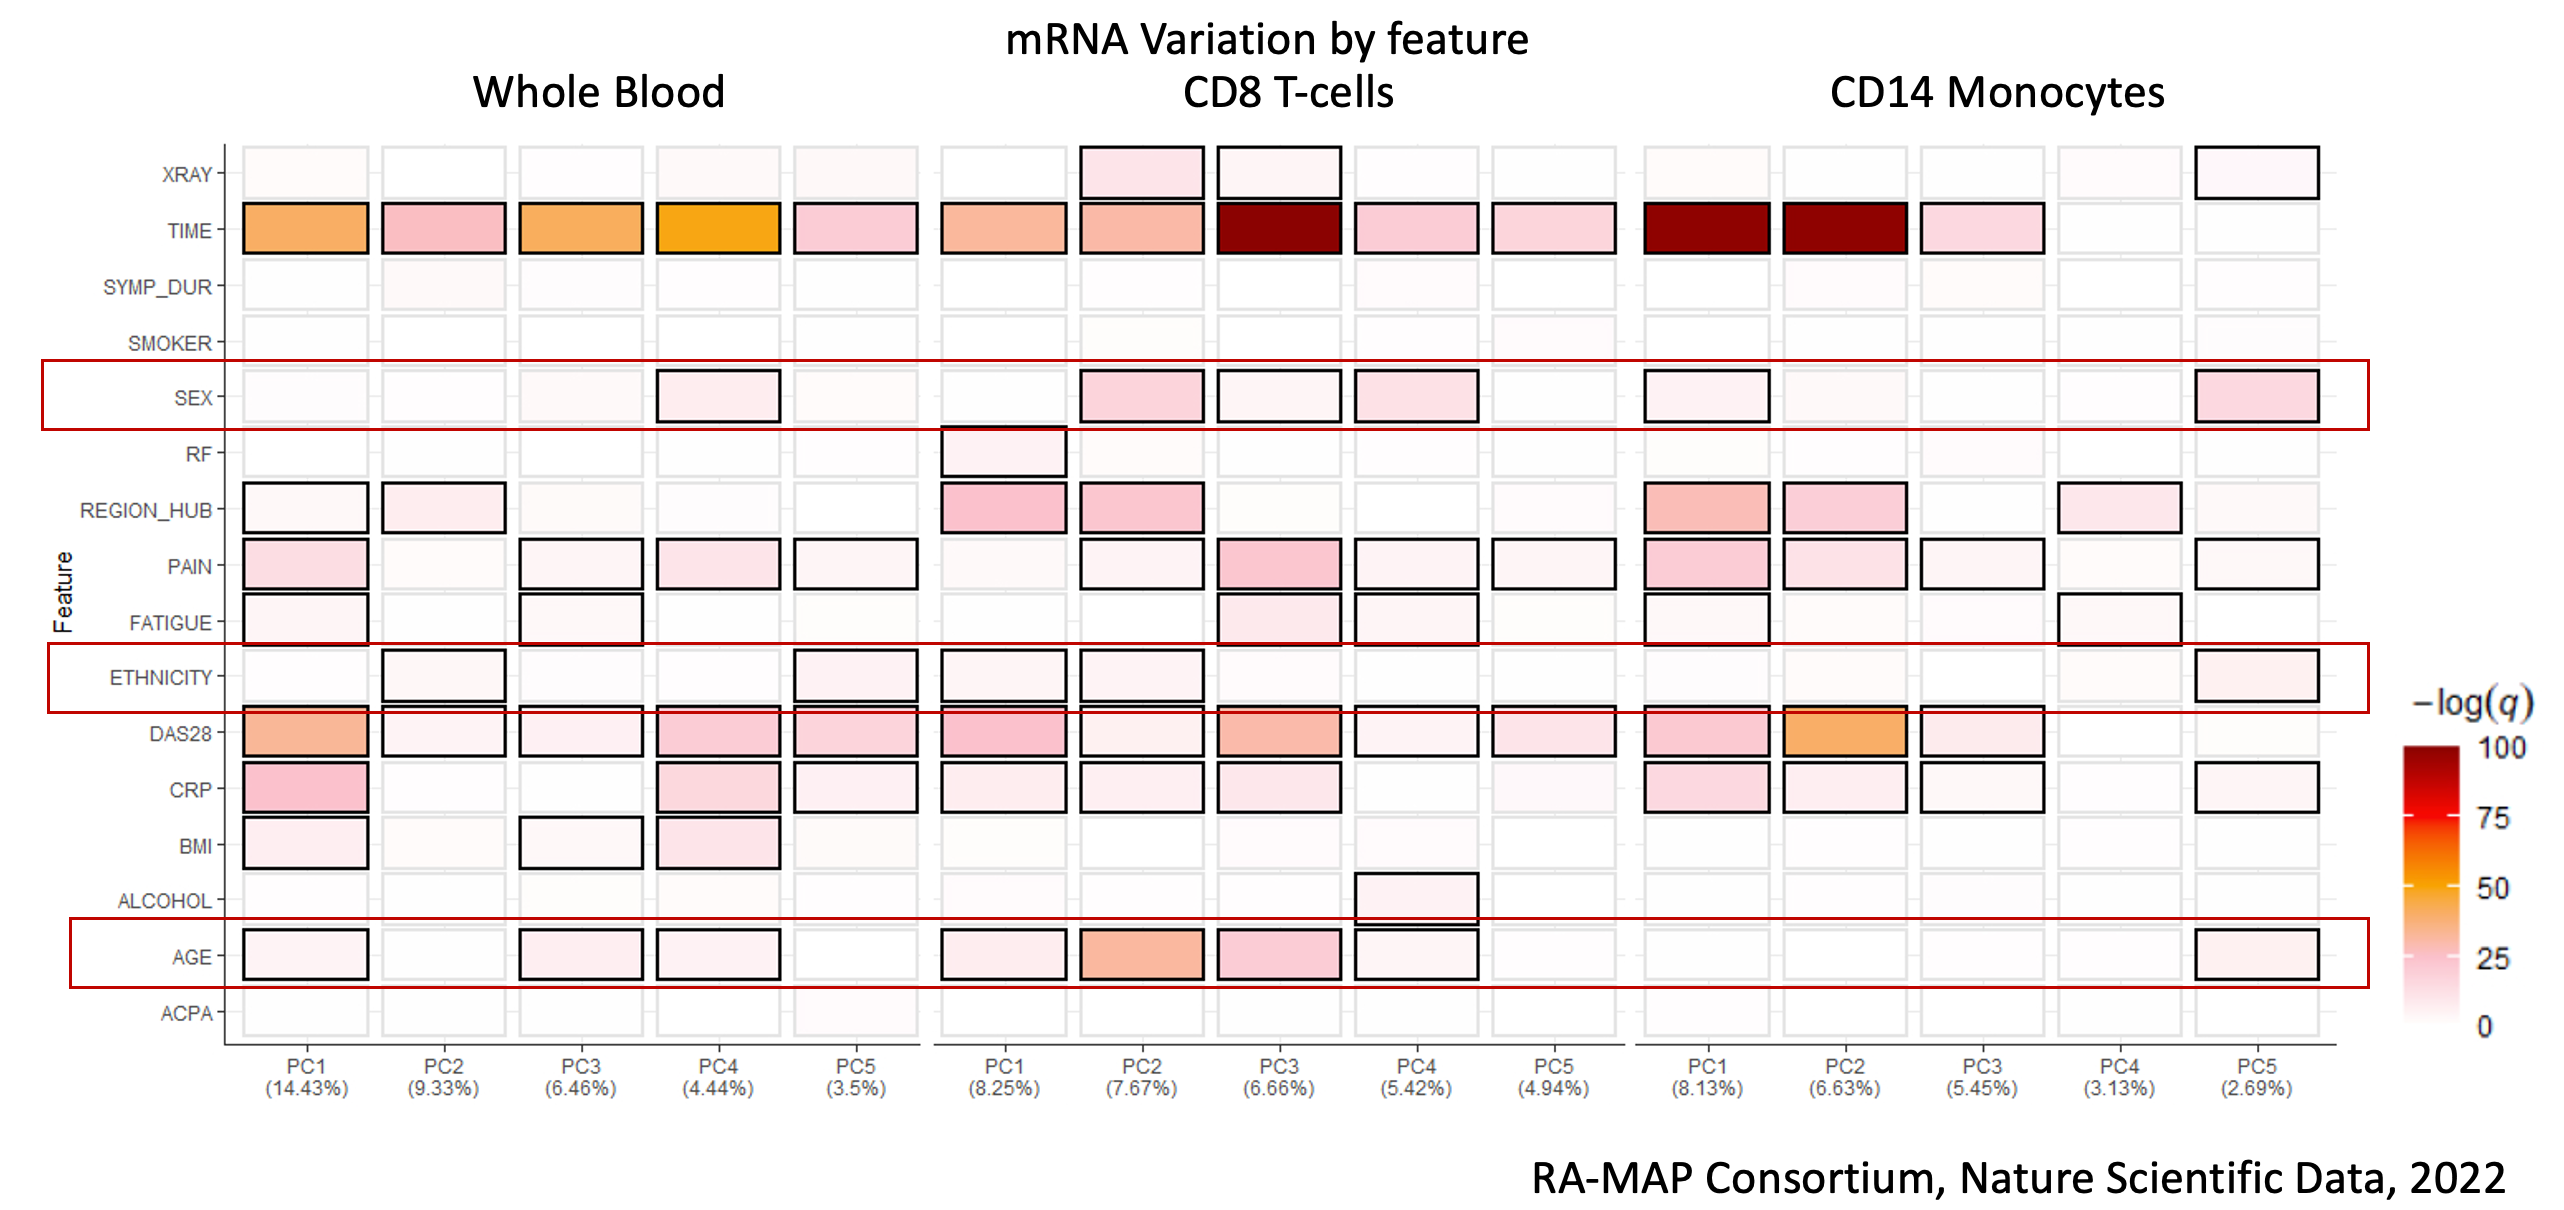
In some recent work in rheumatoid arthritis The RA-MAP Consortium, 2022, it was demonstrated that simple patient demographics such as sex, ethnicity and age are all drivers of expression variation in addition to disease activity. Principal component driver plots highlighted critical associations between diverse clinical features and omics. This shows how rich clinical information may be key to analysis in some, if not, many diseases.
Figure 1: Example of Unsupervised PCA Driver analysis of multi-omic compartments from the RA-MAP study, showing clinical features and their degree of association with Principal Components 1-5. Image from: [RA-MAP, molecular immunologival landscapes in early rheumatoid arthritis and healthy vaccine recipients](https://www.nature.com/articles/s41597-022-01264-y#Tab1)
Hands On: Do the datasets have all these characteristics - time 5 minutes
For your domain, look at datasets on ArrayExpress and GEO and see how many of them have sex, age, ethnicity/race, and some measure of disease activity
Powering up cohorts for analyses and machine learning
For many diseases (or across a family of diseases), there is a need for well-powered cohorts with hundreds to thousands of participants, for analysis purposes. FAIR principles have been widely promoted for omics datasets, but as shown, there are key challenges to meta-analysis. This is illustrated by an example of collating 17 public rheumatoid arthritis studies, which was done as pre-analysis for the RA-MAP study. The clinical data in most cases were sparse and incomplete. For example, of the curated 17 studies, three did not include sex, 5 did not include age and only one study included ethnicity or race. The limitations in the availability of clinical data substantially diminish the value of public data sets and on the surface to not adhere to FAIR principles.
Similarly, in order to make the most of machine learning techniques, datasets need to be reasonably large.
Time-saving
Usually, after finding potentially interesting datasets on GEO or ArrayExpress, the next step in trying to enrich these public datasets is to contact the PI of the study to request additional data. From experience, the PI is usually happy to share additional data, especially if there have been previous collaborations. However, even given the willingness to share, there is a time-consuming process of contacting the person who has the data and reaching agreement on what can and will be shared. This at best will take weeks, but most likely months, especially if there is a lapse in communication between parties.
By implementing some of the techniques described in the next section can help release rich and FAIR data and metadata in a timely fashion.
Practical techniques to make clinical data FAIR
There are certain privacy concerns when making clinical data freely available through public libraries such as GEO and ArrayExpress. Data needs to be anonymised, or at least pseudo-anonymised.
Hands On: What data would be problematic to share? - time 5 minutes
Take a look at the data below and consider which columns and data may be problematic to share
Remove columns C (FIRST), D (LAST), H (ADDRESS) and L (ZIP) as these are clear identifiers of the person
In terms of location, it is preferable to keep this as broad as possible. In this case, keep column J (STATE) but drop columns I (CITY) and
K (COUNTY). It is debatable whether to keep them or not
Column B (BIRTHDATE) is another clear identifier but could be replaced by age
It is preferable not to keep dates (Columns (DATEOFASSESSMENT) and N (DATEOFDISEASEONSET))
We will discuss date handling in the next section
Converting dates to time periods
Avoid including dates and convert these into time periods. For example, use date of birth and date of assessment to calculate Age (at assessment or baseline). Similarly, calculate Age at Diagnosis, and Age at Onset, if dates are given.
If there are more than one visits, and if these are not within roughly defined time periods, for example, 4 weeks, or 12 weeks, calculate the number of days between the visits.
Hands On: Which columns would you change to time periods from dates? - time 10 minutes
For the dataset below identify the column you would change to time periods and convert them to time periods
When publishing omics datasets to libraries such as GEO and ArrayExpress, consider at least including Age, Sex, Race/Ethnicity, and if possible some disease activity measure. Publishing as much as possible is great for researchers to access enriched datasets, and also reduces fielding queries and requests to the PI.
Data dictionaries
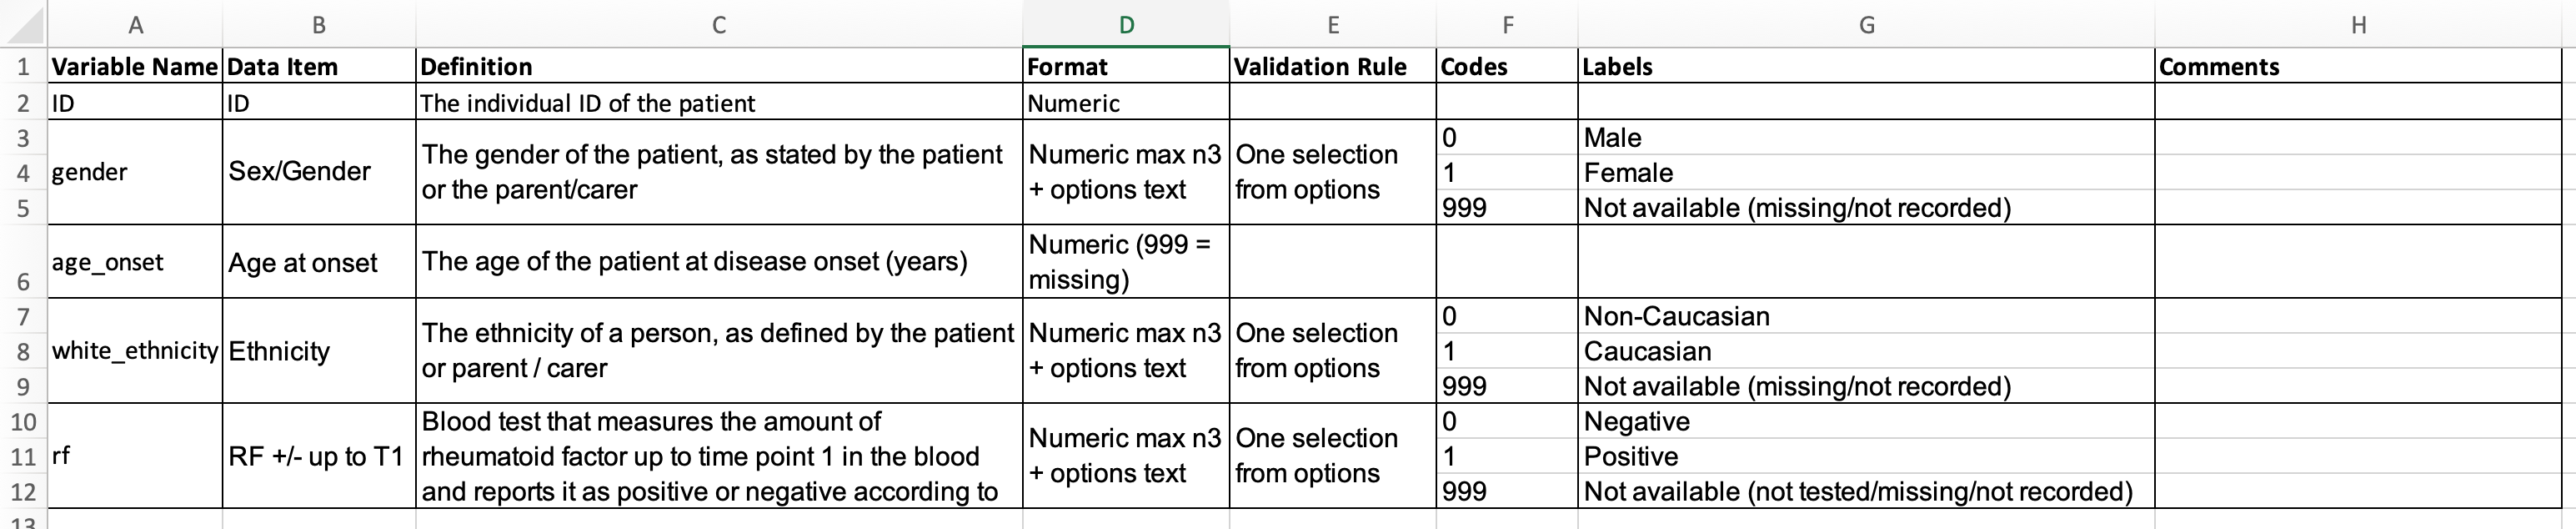
There are cases when PIs would rather not have the clinical datasets on free-to-access platforms. In these situations, the clinical datasets can still be made FAIR. By having clear documentation of the datasets, these documents can be published and attributed to the project or consortia. For each individual clinical dataset, it is useful to have a data dictionary.
A data dictionary is the metadata of the dataset. It should include details such as data type, value range or allowed values, any relationship to other data elements and their meaning or purpose. The details of the data dictionary often originate from how the data was input either at the source or into the database.
Here’s an example of a data dictionary used on a project
Figure 7: Example of a data dictionary for the above dataset
A key benefit of data dictionaries is that the information captured is generally not confidential or patient-sensitive and, therefore, there are few if any restrictions to sharing them.
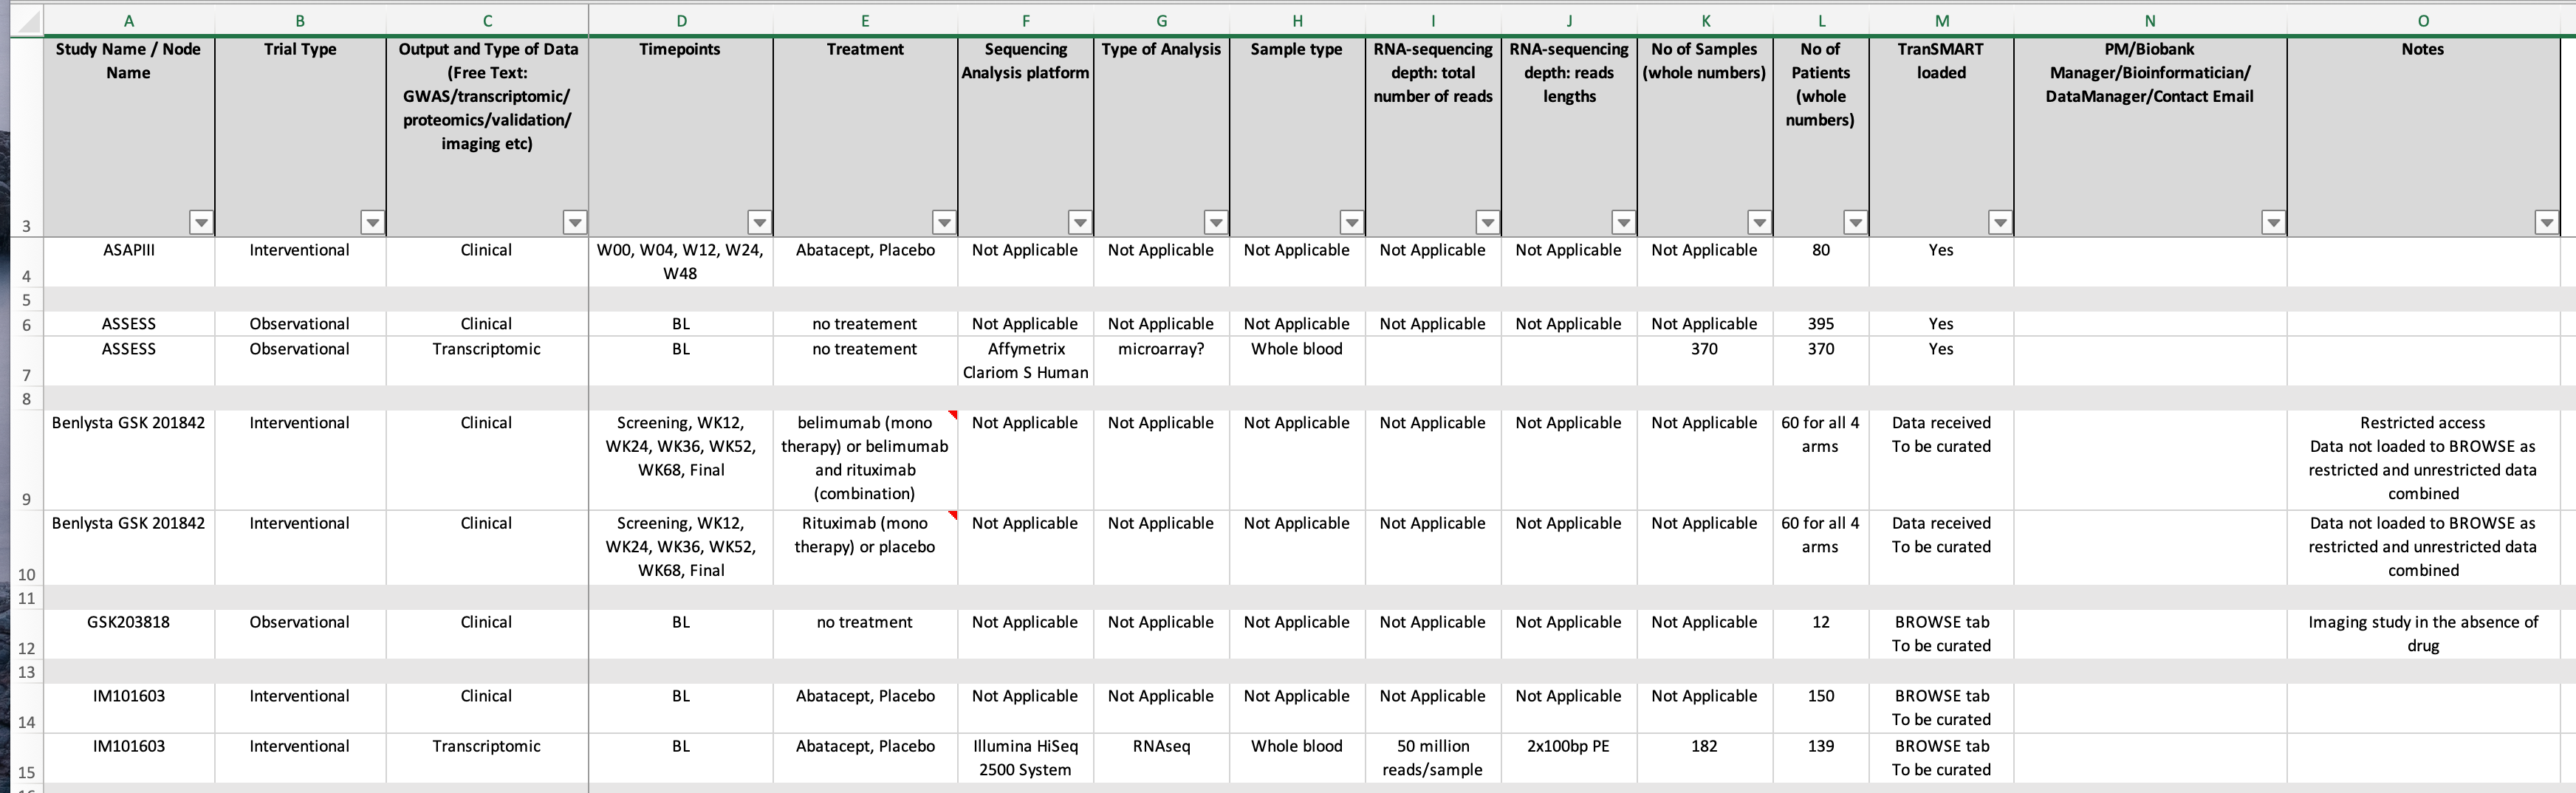
Data catalogues
Data catalogues are useful for teams, projects or consortia where there are many datasets being used and generated by the group. Data catalogues are the metadata for the individual datasets, and they can provide context and provenance for each dataset within the group of datasets.
You may not want to capture all these metadata, and you may want to include other items such as phenotype, links to any publications related to the dataset, and links to the published dataset.
Additionally, if there are complex data-sharing agreements, this information could be added to the catalogue (for internal use).
When projects and consortia are live, the corresponding data catalogue is a work in progress alongside the project and needs to be updated as required. Although data catalogues can be somewhat time-consuming to set up, this is more than made up with the time saved looking for details about datasets, especially as people switch in and out of the team.
As with data dictionaries, data catalogues rarely capture any information that needs to be restricted access and usually can be shared in full. The exception potentially may be the contact person’s email address.
Data dictionaries and data catalogues include a wealth of information about the clinical datasets they reference, and in general, contain no sensitive or confidential data. Zenodo is an open repository for research outcomes hosted by CERN. It is free to use and each upload is citeable through a Digital Object Identifier (DOI). Uploads are instantly available, with version control features. Publishing on platforms such as Zenodo can help make your data findable.
Here, you can see published data dictionaries for a consortium
Figure 9: Screenshot of CLUSTER Consortium community page on Zenodo website
To upload, create a login using GitHub ID, ORCID, or email. Click on Upload (at the top of the page, left of centre), and follow the instructions.
Managing Data Access Requests
Regardless of whether or not you publish data dictionaries and data catalogues, it is worth considering the mechanisms when receiving data access requests.
When a project is ongoing, if there is a Data Management Committee (DMC), the responsibility for data access requests would be with the DMC. It is really helpful to have a centralised point to provide data governance including guidelines for data sharing.
It is really worthwhile clarifying the process of handling data access requests to minimise effort and delays for both the data holder and the data requester. This process may need to be revised as the project ends.
Who will be the point of contact and the email address (e.g. create a general project email that is handled by the project administration team)
Expected length of time before requester receives a response
Involve the institution’s legal team
Terms and conditions of use of data and/or samples
Publication guidelines
Standardise the process with a Data Access Request Form
An example of a data access process is shown below
In the UK, for members of the UK Health Data Research Alliance, the HDRUK Innovation Gateway may also be a way to manage the data access request process. This requires the metadata of the health datasets to be loaded to the Gateway web portal. Researchers with an account can then search the portal and request access to datasets. The request access process and also creating collections of metadata are described in more detail in the Data Custodian Playbook
This work was funded by the ELIXIR-UK: FAIR Data Stewardship training UKRI award (MR/V038966/1).
You've Finished the Tutorial
Please also consider filling out the Feedback Form as well!
Key points
FAIR data are data that meet principles of findability, accessibility, interoperability, and reusability (FAIR).
Frequently Asked Questions
Have questions about this tutorial? Have a look at the available FAQ pages and support channels
Did you use this material as an instructor? Feel free to give us feedback on how it went.
Did you use this material as a learner or student? Click the form below to leave feedback.
Hiltemann, Saskia, Rasche, Helena et al., 2023 Galaxy Training: A Powerful Framework for Teaching! PLOS Computational Biology 10.1371/journal.pcbi.1010752
Batut et al., 2018 Community-Driven Data Analysis Training for Biology Cell Systems 10.1016/j.cels.2018.05.012
@misc{fair-fair-clinical,
author = "Sandra Ng",
	title = "Making clinical datasets FAIR (Galaxy Training Materials)",
	year = "",
	month = "",
	day = "",
	url = "\url{https://training.galaxyproject.org/training-material/topics/fair/tutorials/fair-clinical/tutorial.html}",
	note = "[Online; accessed TODAY]"
}
@article{Hiltemann_2023,
	doi = {10.1371/journal.pcbi.1010752},
	url = {https://doi.org/10.1371%2Fjournal.pcbi.1010752},
	year = 2023,
	month = {jan},
	publisher = {Public Library of Science ({PLoS})},
	volume = {19},
	number = {1},
	pages = {e1010752},
	author = {Saskia Hiltemann and Helena Rasche and Simon Gladman and Hans-Rudolf Hotz and Delphine Larivi{\`{e}}re and Daniel Blankenberg and Pratik D. Jagtap and Thomas Wollmann and Anthony Bretaudeau and Nadia Gou{\'{e}} and Timothy J. Griffin and Coline Royaux and Yvan Le Bras and Subina Mehta and Anna Syme and Frederik Coppens and Bert Droesbeke and Nicola Soranzo and Wendi Bacon and Fotis Psomopoulos and Crist{\'{o}}bal Gallardo-Alba and John Davis and Melanie Christine Föll and Matthias Fahrner and Maria A. Doyle and Beatriz Serrano-Solano and Anne Claire Fouilloux and Peter van Heusden and Wolfgang Maier and Dave Clements and Florian Heyl and Björn Grüning and B{\'{e}}r{\'{e}}nice Batut and},
	editor = {Francis Ouellette},
	title = {Galaxy Training: A powerful framework for teaching!},
	journal = {PLoS Comput Biol}
}
Funding
These individuals or organisations provided funding support for the development of this resource
Congratulations on successfully completing this tutorial!
2 stars
1
April 2024
2 stars:
Liked: I liked the topic itself, as well as the hands on guidelines with quiz
Disliked: The narrative is to long and to monotonous. It can be simplified.
Questions:
 Open image in new tab
Open image in new tab
Open image in new tab
Open image in new tab
 Open image in new tab
Open image in new tab
Open image in new tab
 Open image in new tab
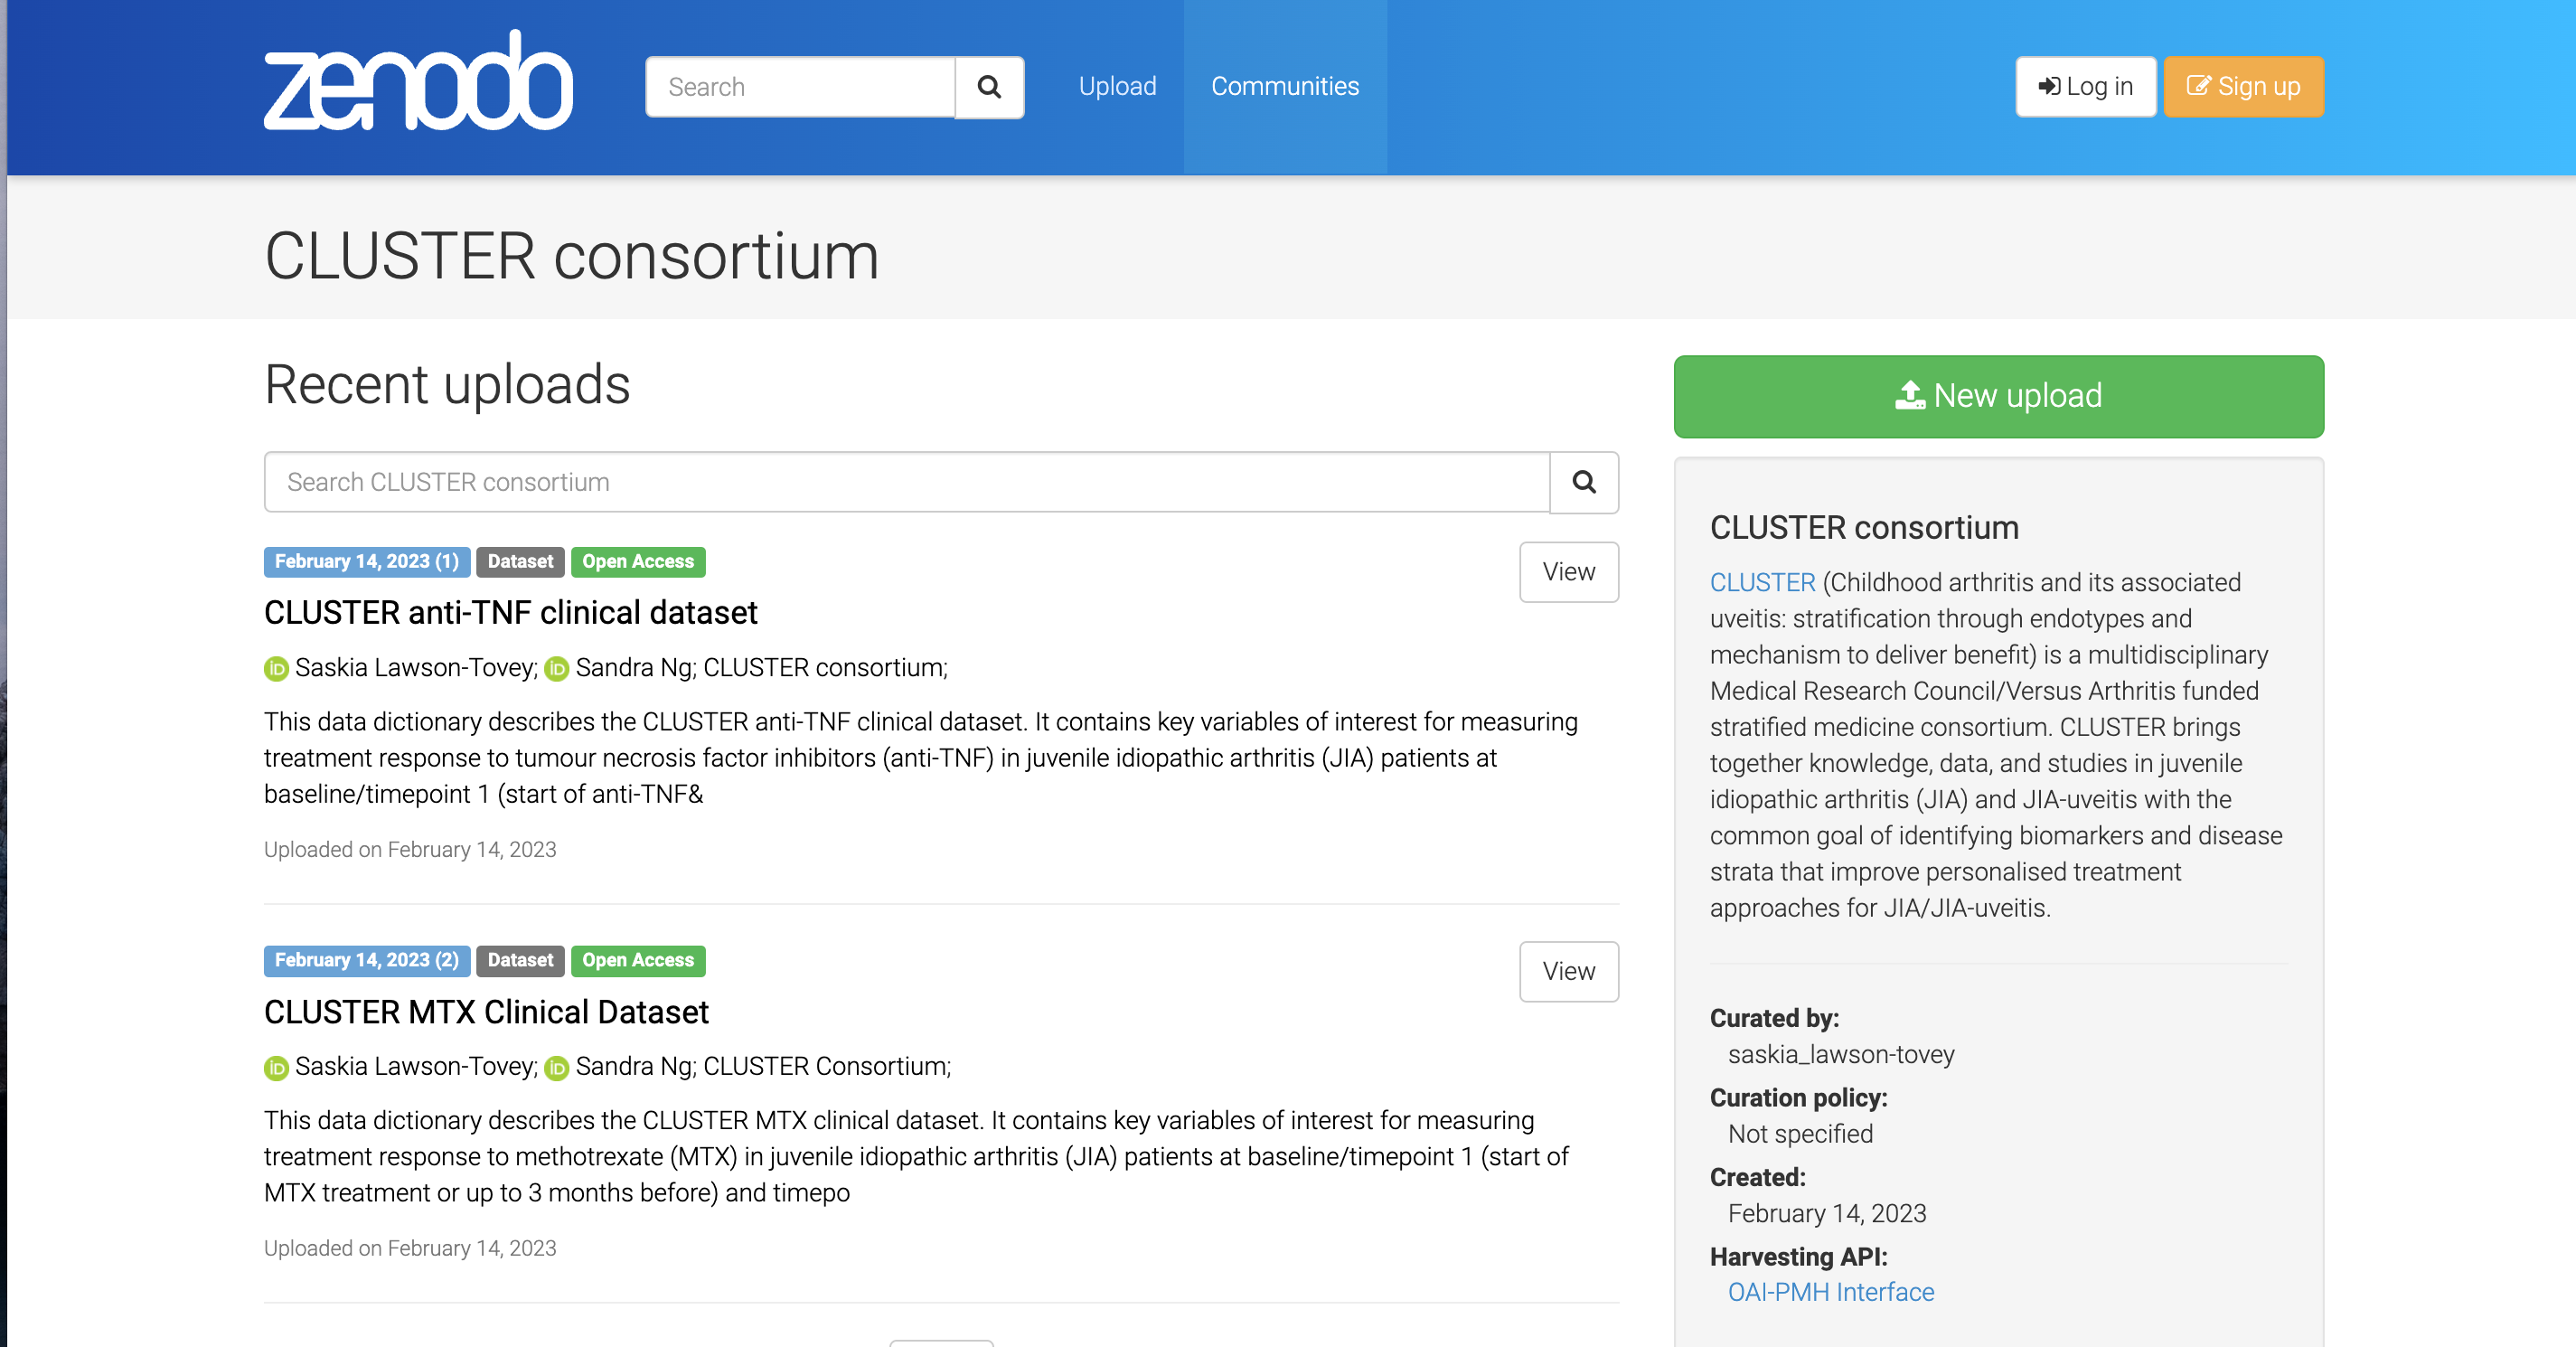 Open image in new tab
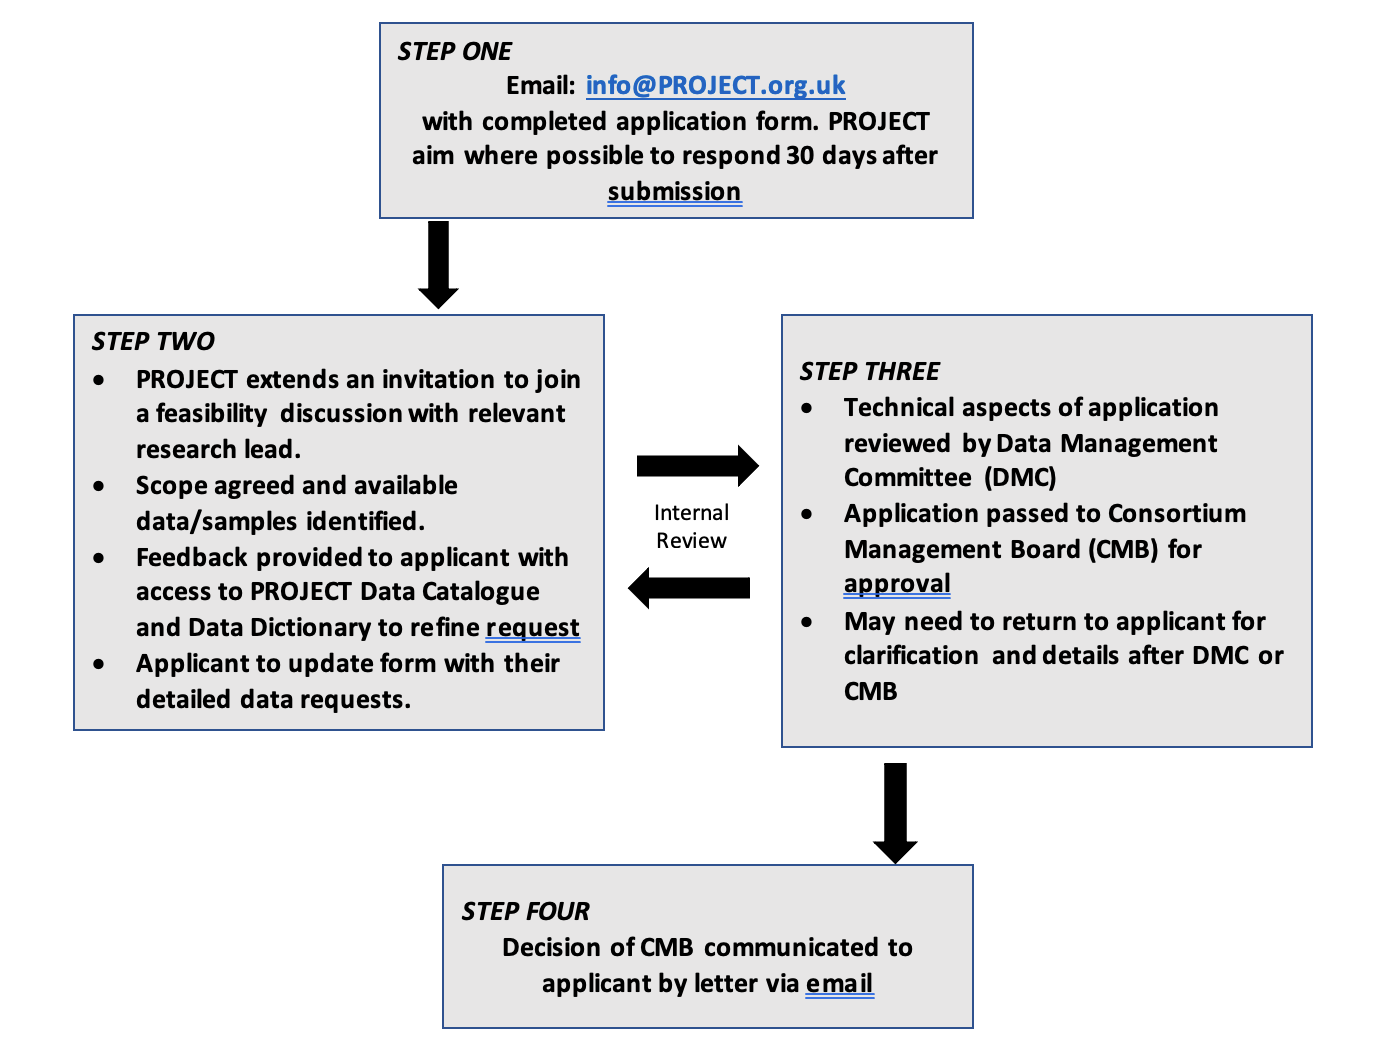 Open image in new tab