metaQuantome 2: Function
| Author(s) |
|
| Reviewers |
|
OverviewQuestions:
Objectives:
How do I look at differentially expressed proteins?
How do I get top 5 or 10 function present in the sample?
How can I visualize my results?
Requirements:
A functional and quantitational analysis of metaproteomic mass spectrometry data.
Time estimation: 1 hourLevel: Intermediate IntermediateSupporting Materials:Published: Oct 29, 2020Last modification: Mar 15, 2024License: Tutorial Content is licensed under Creative Commons Attribution 4.0 International License. The GTN Framework is licensed under MITpurl PURL: https://gxy.io/GTN:T00223version Revision: 14
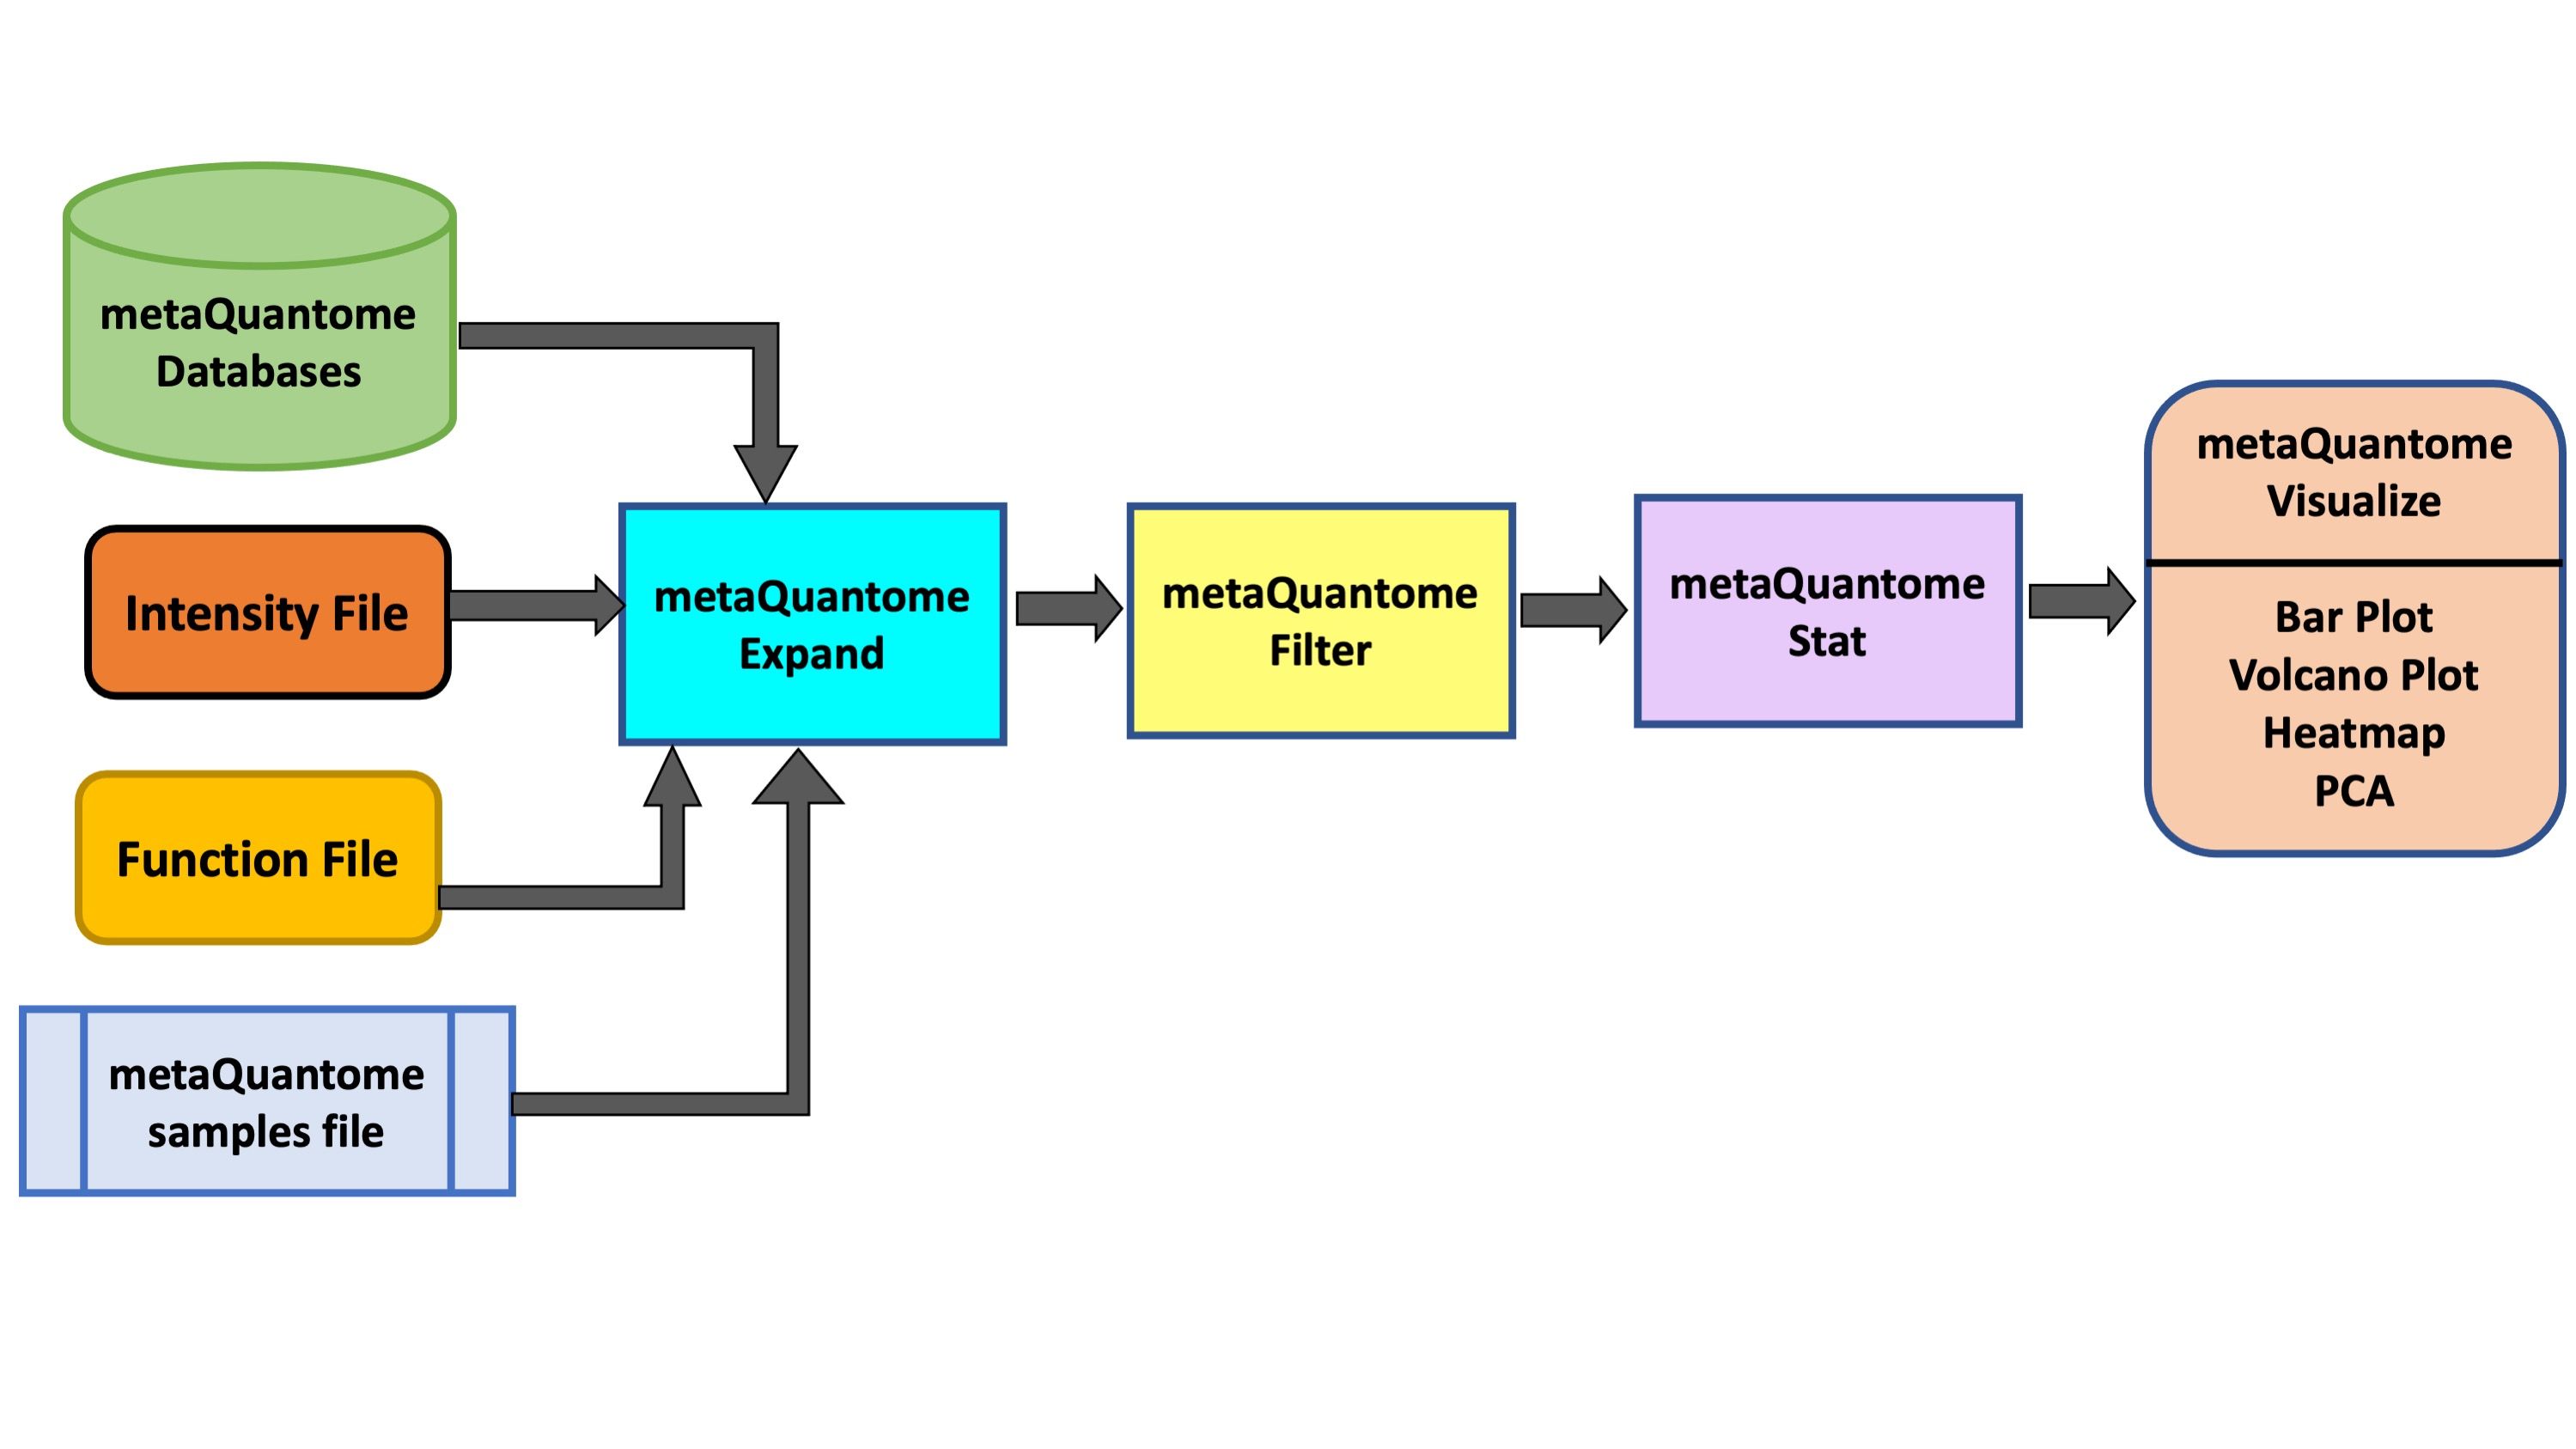
metaQuantome software suite Easterly et al. 2019 was developed by the Team for quantitative and statistical analysis of metaproteomics data. For taxonomic and functional expression analysis within the microbial community, metaQuantome leverages peptide-level quantitative information to generate visual outputs for data interpretation. It also generates outputs that help in understanding the taxonomic contribution to a selected function as well as functions expressed by selected taxonomic group.
In this tutorial, we will learn specifically about the metaQuantome Function workflow. In particular, we will learn about how peptide-level quantitation and associated functional information can be used to generate bar plots (for functional information such as molecular function, cellular components and biological processes), volcano plots (to detect differentially expressed function) and heatmap cluster analysis. To demonstrate the use of this workflow, we have used a thermophilic biogas reactor dataset wherein municipal food waste and manure is digested to generate methane gas (Delogu et al. 2020). After one round in the reactor, the microbial community was simplified and enriched via serial dilution. This inoculum was then transferred to a solution of cellulose from Norwegian Spruce and incubated at 65°C. Triplicate samples were taken in a time series from 0 to 43 hours after inoculation and mass spectrometry data was acquired on a Q-Exactive (Thermo) mass spectrometer. For this training, we have chosen three time points (8 hours, 18 hours and 33 hours) from this dataset.
 Open image in new tab
AgendaIn this tutorial, we will cover:
Pretreatments
The first step in this tutorial is to get the data from the Zenodo link provided and make sure that it is in the correct format.
Get data
Hands On: Data upload
Create a new history for this tutorial and give it a meaningful name
To create a new history simply click the new-history icon at the top of the history panel:
- Click on galaxy-pencil (Edit) next to the history name (which by default is “Unnamed history”)
- Type the new name
- Click on Save
- To cancel renaming, click the galaxy-undo “Cancel” button
If you do not have the galaxy-pencil (Edit) next to the history name (which can be the case if you are using an older version of Galaxy) do the following:
- Click on Unnamed history (or the current name of the history) (Click to rename history) at the top of your history panel
- Type the new name
- Press Enter
Import the files from Zenodo: a Functional File and an Intensity file.
https://zenodo.org/record/4110725/files/Function-File.tabular
https://zenodo.org/record/4110725/files/Intensity-File.tabular
- Copy the link location
Click galaxy-upload Upload at the top of the activity panel
- Select galaxy-wf-edit Paste/Fetch Data
Paste the link(s) into the text field
Press Start
- Close the window
Alternatively, import the files from the shared data library (
GTN - Material->proteomics->metaQuantome 2: Function)As an alternative to uploading the data from a URL or your computer, the files may also have been made available from a shared data library:
- Go into Libraries (left panel)
- Navigate to the correct folder as indicated by your instructor.
- On most Galaxies tutorial data will be provided in a folder named GTN - Material –> Topic Name -> Tutorial Name.
- Select the desired files
- Click on Add to History galaxy-dropdown near the top and select as Datasets from the dropdown menu
In the pop-up window, choose
- “Select history”: the history you want to import the data to (or create a new one)
- Click on Import


Download metaQuantome Databases
Hands On: Run metaQuantome databases
- metaQuantome: databases ( Galaxy version 2.0.0-0) with the following parameters:
- param-select “Databases to Download”:
Select All(NCBI Taxonomy Database, Gene Ontology Database and Enzyme Commission (EC) database)CommentmetaQuantome uses freely available bioinformatic databases to expand your set of direct annotations.
The databases are:
NCBI taxonomy database. consists of a list of all currently identified taxa and the relationships between them.
Gene Ontology (GO) term database. metaQuantome uses the go-basic.obo file and the metagenomics slim GO (subset of the full GO). More details are available at http://geneontology.org/docs/download-ontology/
ENZYME database with Enzyme Classification (EC) numbers. This database classifies enzymes and organizes the relationships between them.
Question
- Why is it necessary to download metaQuantome databases?
- Can these databases be downloaded from other sources?
- metaQuantome databases help the metaQuantome:expand tool to co-relate information your have provided in your input files according to the GO term, taxa or EC databases and its relationship .
- For metaQuantome, we use freely available databases. This module downloads the most recent releases of the specified databases and stores them in a single file, which can then be accessed by the rest of the metaQuantome modules. For reference, the taxonomy database is the largest (~500 Mb), while the GO and EC databases are smaller: ~34 Mb and ~10Mb, respectively. Also, note that the databases will be stored in the history so that the date of download can be referenced later. Thus, the databases will not be modified, except for the NCBI database.
Create metaQuantome sample file
The create samples file module is used to generate the samples file input file for the metaQuantome workflow. This input file is used to specify the column names used for each experimental group. These column names are referenced when handling the input data and performing statistical analysis.
Hands On: Create an experimental Design file for sorting samples
- metaQuantome: create samples file ( Galaxy version 2.0.0-0) with the following parameters:
- param-select “Sample file creation method”:
Manually specify experimental conditions and samples- In “Insert Samples”:
- “1.Samples”:
- “Group Name”:
T2
- “Column”:
T2_A1,T2_B1- “2.Samples”:
- “Group Name”:
T4
- “Column”:
T4A_1,T4B_1- “3.Samples”:
- “Group Name”:
T7
- “Column”:
T7A_1,T7B_1
Run metaQuantome
metaQuantome: expand
The expand module is the first analysis step in the metaQuantome analysis workflow, and can be run to analyze differently expressed functions in the samples. In function mode, the following information is required apart from metaQuantome databases and samples file:
- The name of the peptide column in the functional annotation file (
peptide) - The name of the functional annotation column in the functional annotation file (
go_term) - The name of the peptide column in the Intensity file (
peptide)
Hands On: Run metaQuantome expand
- metaQuantome: expand ( Galaxy version 2.0.0-0) with the following parameters:
- param-file “Database Archive File”:
metaQuantome databases(output of metaQuantome: database tool)- param-file “Samples file”:
metaQuantome: create samples_file(output of metaQuantome: create samples file tool)- “Mode”:
Functional analysis
- param-file “Functional file”:
Function File(Input dataset)- “Functional file: peptide column name”:
peptide- “Ontology”:
Gene Ontology (GO terms)- “Functional column name”:
go_term- param-file “Intensity file”:
Intensity File(Input dataset)
- “Intensity file: peptide column name”:
peptideRename galaxy-pencil the output file to
metaQuantome expand.CommentThe structure of the output file depends on the analysis mode and the experimental design, but the columns generally look like this, with one row for each term:
term id info about term. (one or more columns) mean term intensity (by sample group) term intensity (by sample) number of unique peptides (by sample) number of sample children in each sample term1 name, rank, etc. note that this is the log2 of the mean intensity this is the log2 of term intensity in each sample. Missing data is coded as NA. integer. 0 is coded as NA integer. 0 is coded as NA
metaQuantome: filter
The filter module is the second step in the metaQuantome workflow. The filter module filters the expanded terms to those that are representative of the data according to the sample parameters the user has specified.
Hands On: Filtering the expanded data
- metaQuantome: filter ( Galaxy version 2.0.0-0) with the following parameters:
- “Mode”:
Functional analysis
- “Ontology”:
Gene Ontology (GO terms)- param-file “Samples file”:
metaQuantome:create samples_file(output of metaQuantome: create samples file tool)- param-file “metaquantome expand file”:
metaQuantome:expand(output of metaQuantome: expand tool)- “min_peptides”:
1- “min_pep_nsamp”:
1- “min_children_non_leaf”:
2- “min_child_nsamp”:
1- “qthreshold”:
2Rename galaxy-pencil the output file to
metaQuantome:Filter.CommentTo learn more about the filter module please read the metaQuantome paper published by Galaxy-P Easterly et al. 2019.
Question
- Can we change the filter parameters?
- The parameters can be changed according to the experimental design or depending on the data.
metaQuantome: stat
Hands On: Statistical analysis of the filtered data on multiple conditions.
- metaQuantome: stat ( Galaxy version 2.0.0-0) with the following parameters:
- param-file “Samples file”:
metaQuantome:create samples_file(output of metaQuantome: create samples file tool)- param-file “metaquantome expanded or filtered file”:
metaQuantome:Filter(output of metaQuantome: filter tool)- “Mode”:
Functional analysis
- “Ontology”:
Gene Ontology (GO terms)- “Name of the control sample group of control (used as denominator for fold change evaluation).”:
T2- “Statistical test to perform”:
standard t-test (parametric)- “Perform paired tests”:
YesRename galaxy-pencil the output file to
metaQuantome:stat.CommentIn this tutorial, we have used the sample T2 as the control group for fold change evaluation. The users have the ability to choose their own control sample group. The initial version of the metaQuantome stat module could only process 2 conditions at a time. However, the new update of metaQuantome has the ability to perform statistical analysis across multiple conditions.
Visualize your Data
The outputs of the visualization module of metaQuantome are high-quality, publication-ready visualizations: barplots for the analysis of a single sample or experimental condition and differential abundance analysis, volcano plots, heatmaps, and principal components analysis for comparisons between two or more experimental conditions. Here were are showing 2 visualizations: Barplot and Volcano Plot. The Heatmap and PCA plot for multiple conditions are under development. There are two outputs of the visualization tool : an HTML file (figure) and a tabular output containing the plot data.
metaQuantome: visualize Bar Chart
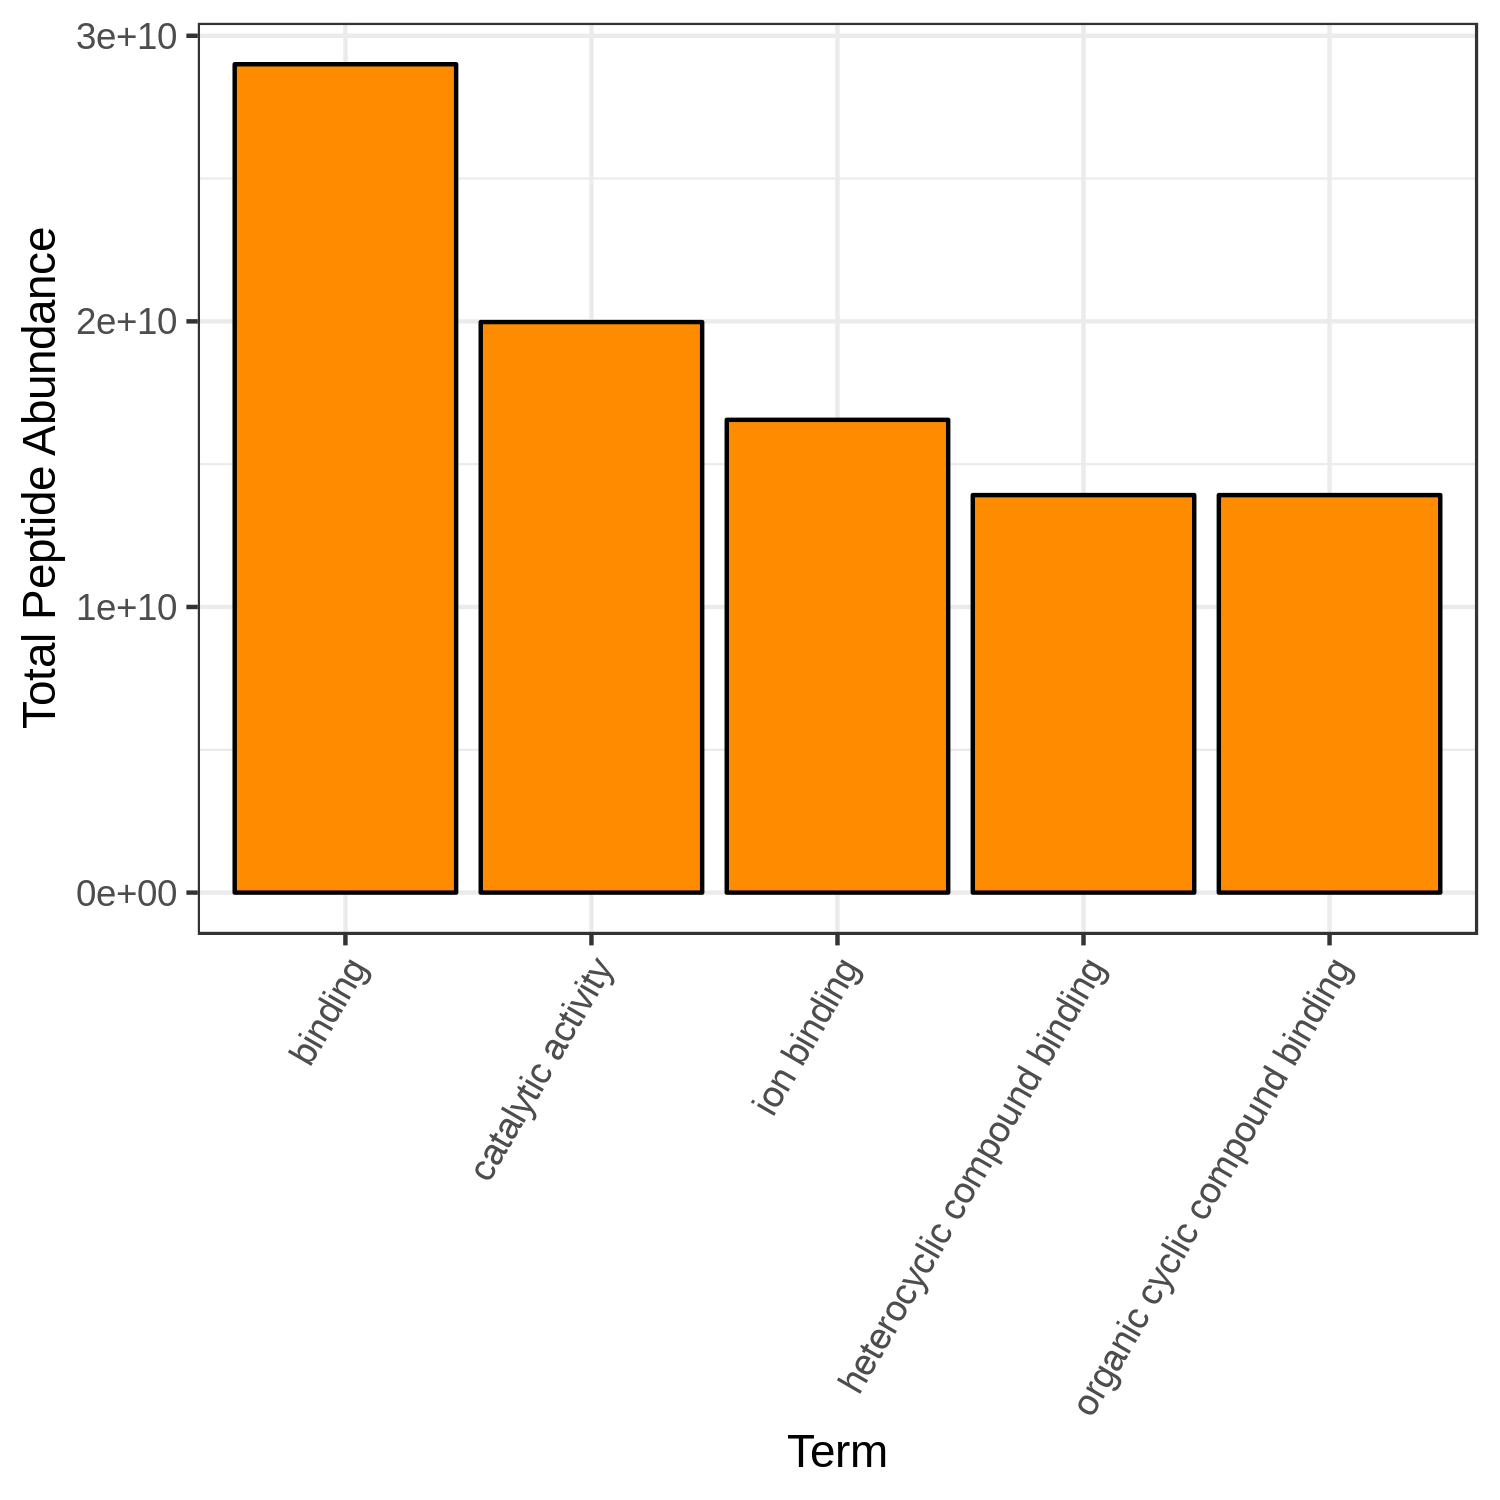
Hands On: Bar chart visualization of Functions in T2 sample.
- metaQuantome: visualize ( Galaxy version 2.0.0-0) with the following parameters:
- param-file “Tabular file from metaQuantome stats or metaQuantome filter”:
metaQuantome:stat(output of metaQuantome: stat tool)- param-file “Samples file”:
metaQuantome:create samples_file(output of metaQuantome: stat tool)- “Mode”:
Functional analysis
- “Plot type”:
Bar Chart (bar)
- “Mean intensity column name”:
T2_mean- “GO category to restrict to”:
Molecular Function- “Color for the bar fill”:
OrangeCommentThe user has a choice to run Bar plot for T2, T4 and T7 to know the top 5 or 10 most differently expressed functions. Here we have restricted the GO category to Molecular Function but the user can choose Biological Processes or Cellular component as their category.
 Open image in new tab
Question
- Can we select any color for the bar chart?
- Can we increase the number of terms to display?
- Yes, the available colors are blue, orange, yellow, violet, black and red.
- Yes, the user can choose their own number, however, the larger the display numbers are the dimensions of the image has to be adjusted accordingly.
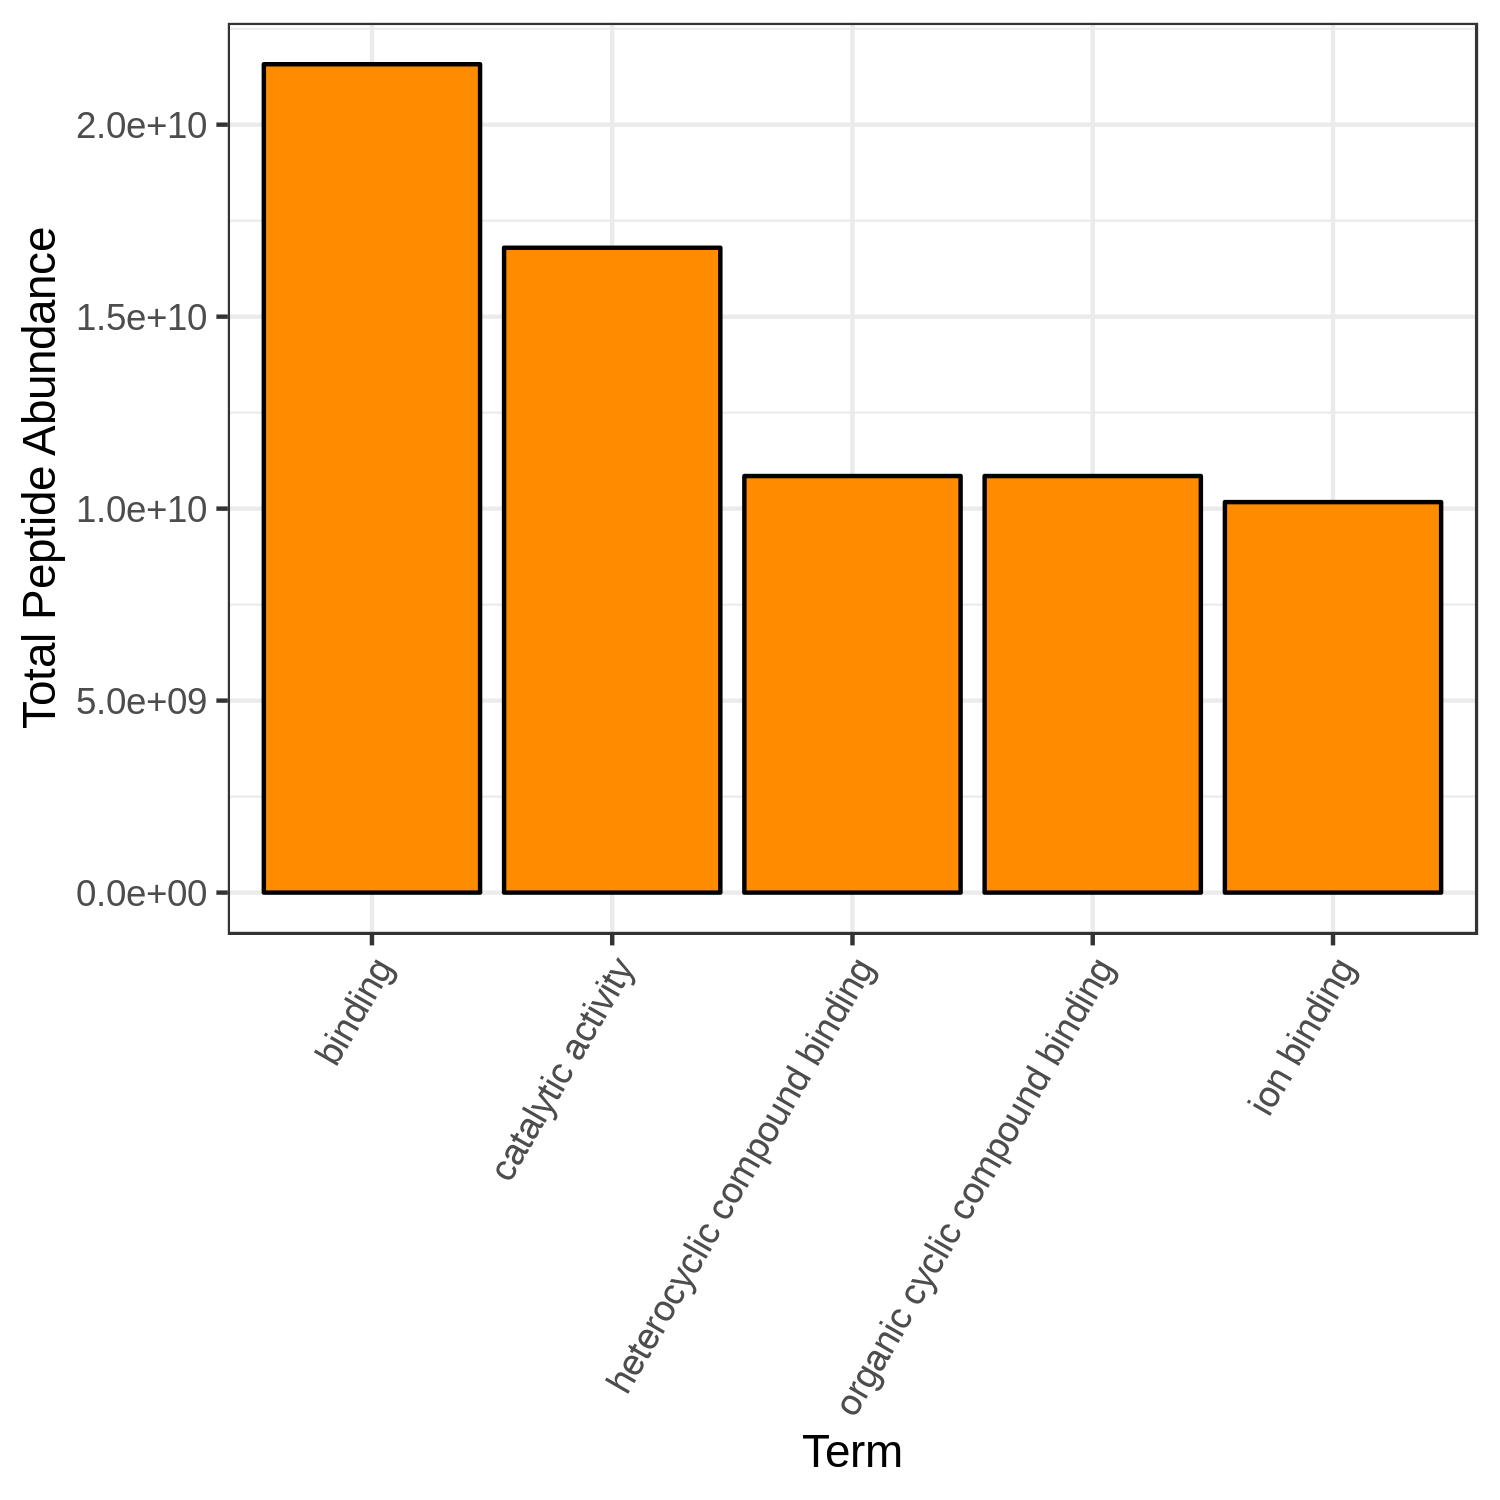
Hands On: Bar chart visualization of Functions in T4 sample.
- metaQuantome: visualize ( Galaxy version 2.0.0-0) with the following parameters:
- param-file “Tabular file from metaQuantome stats or metaQuantome filter”:
metaQuantome:stat(output of metaQuantome: stat tool)- param-file “Samples file”:
metaQuantome:create samples_file(output of metaQuantome: create samples file tool)- “Mode”:
Functional analysis
- “Plot type”:
Bar Chart (bar)
- “Mean intensity column name”:
T4_mean- “GO category to restrict to”:
Molecular Function- “Color for the bar fill”:
Orange
 Open image in new tab
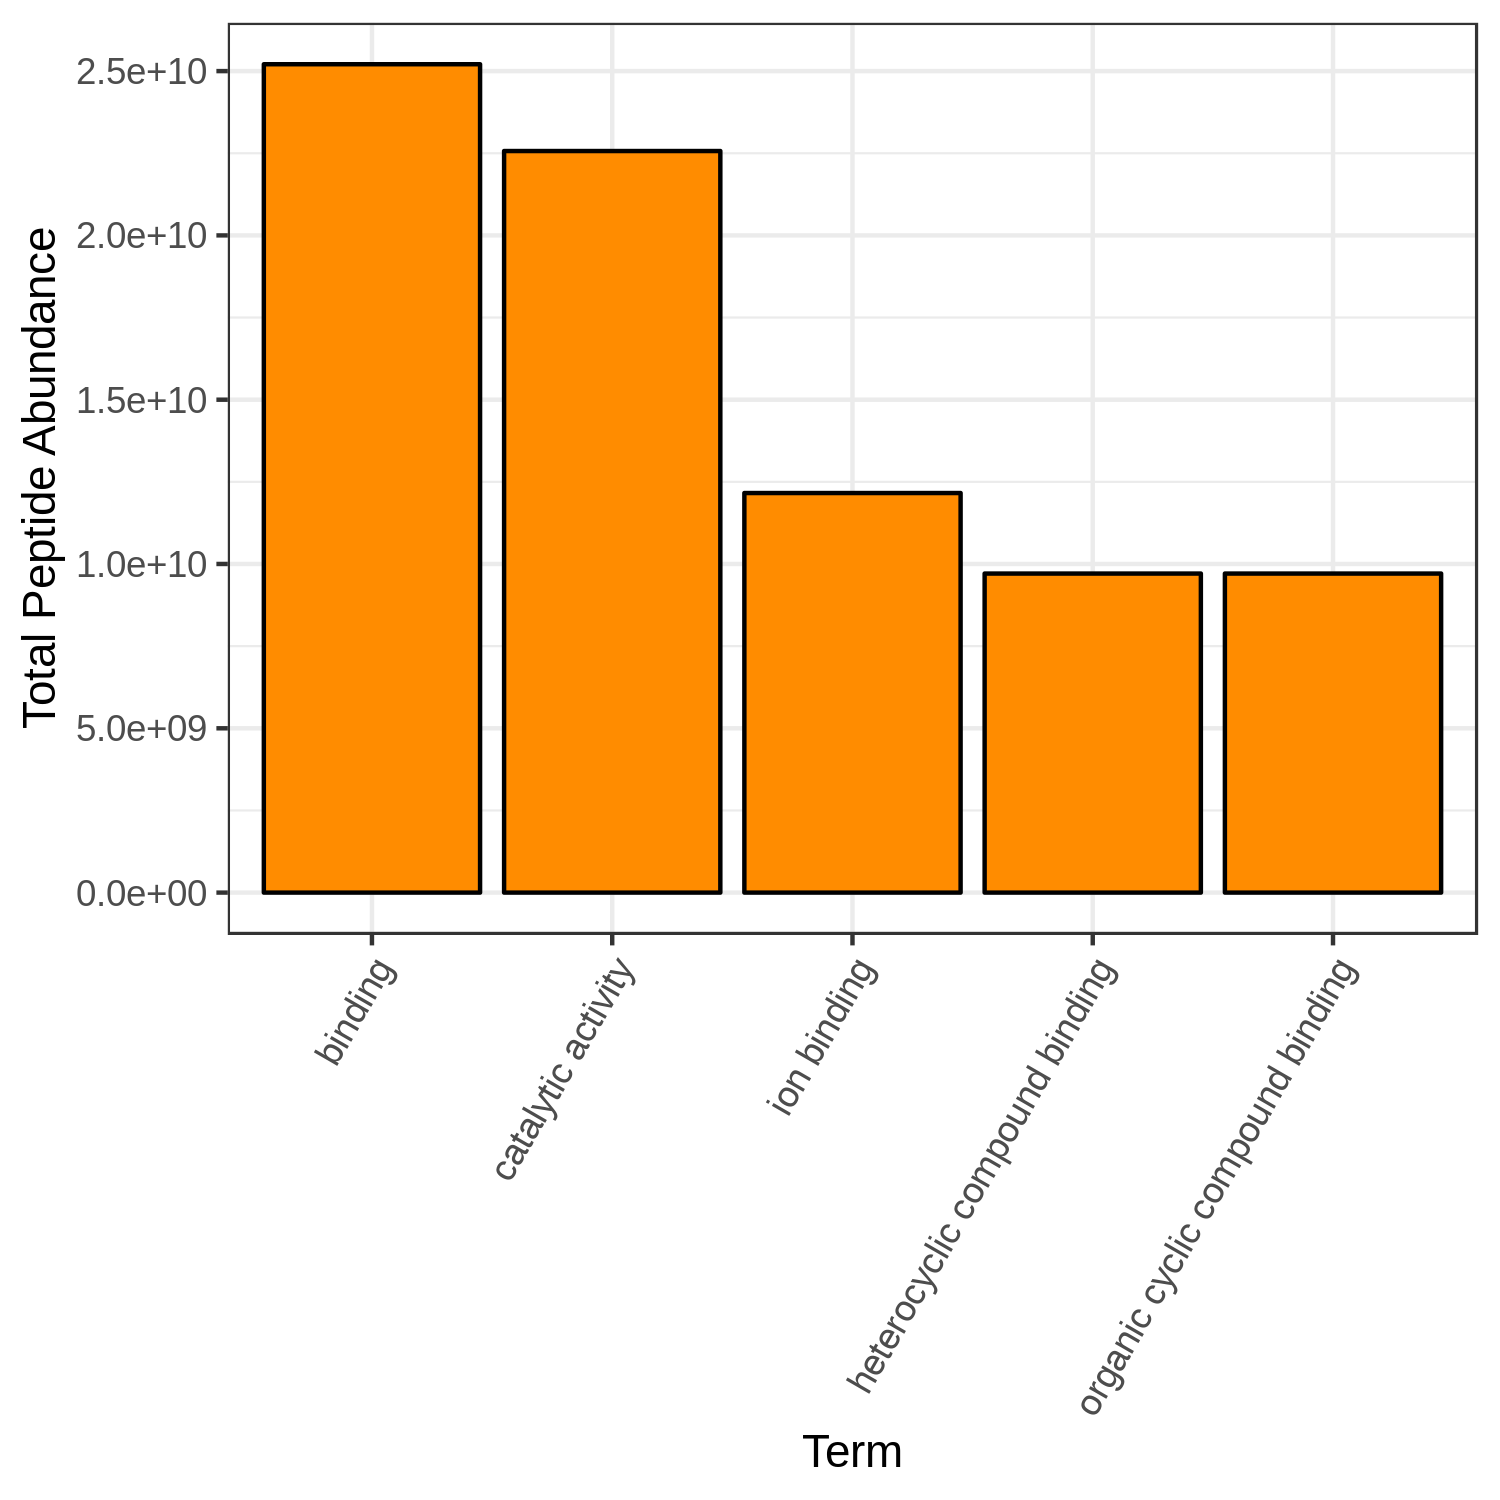
Hands On: Bar chart visualization of Functions in T7 sample.
- metaQuantome: visualize ( Galaxy version 2.0.0-0) with the following parameters:
- param-file “Tabular file from metaQuantome stats or metaQuantome filter”:
metaQuantome:stat(output of metaQuantome: stat tool)- param-file “Samples file”:
metaQuantome:create samples_file(output of metaQuantome: create samples file tool)- “Mode”:
Functional analysis
- “Plot type”:
Bar Chart (bar)
- “Mean intensity column name”:
T7_mean- “GO category to restrict to”:
Molecular Function- “Color for the bar fill”:
Orange
 Open image in new tab
metaQuantome: visualize Volcano Plots
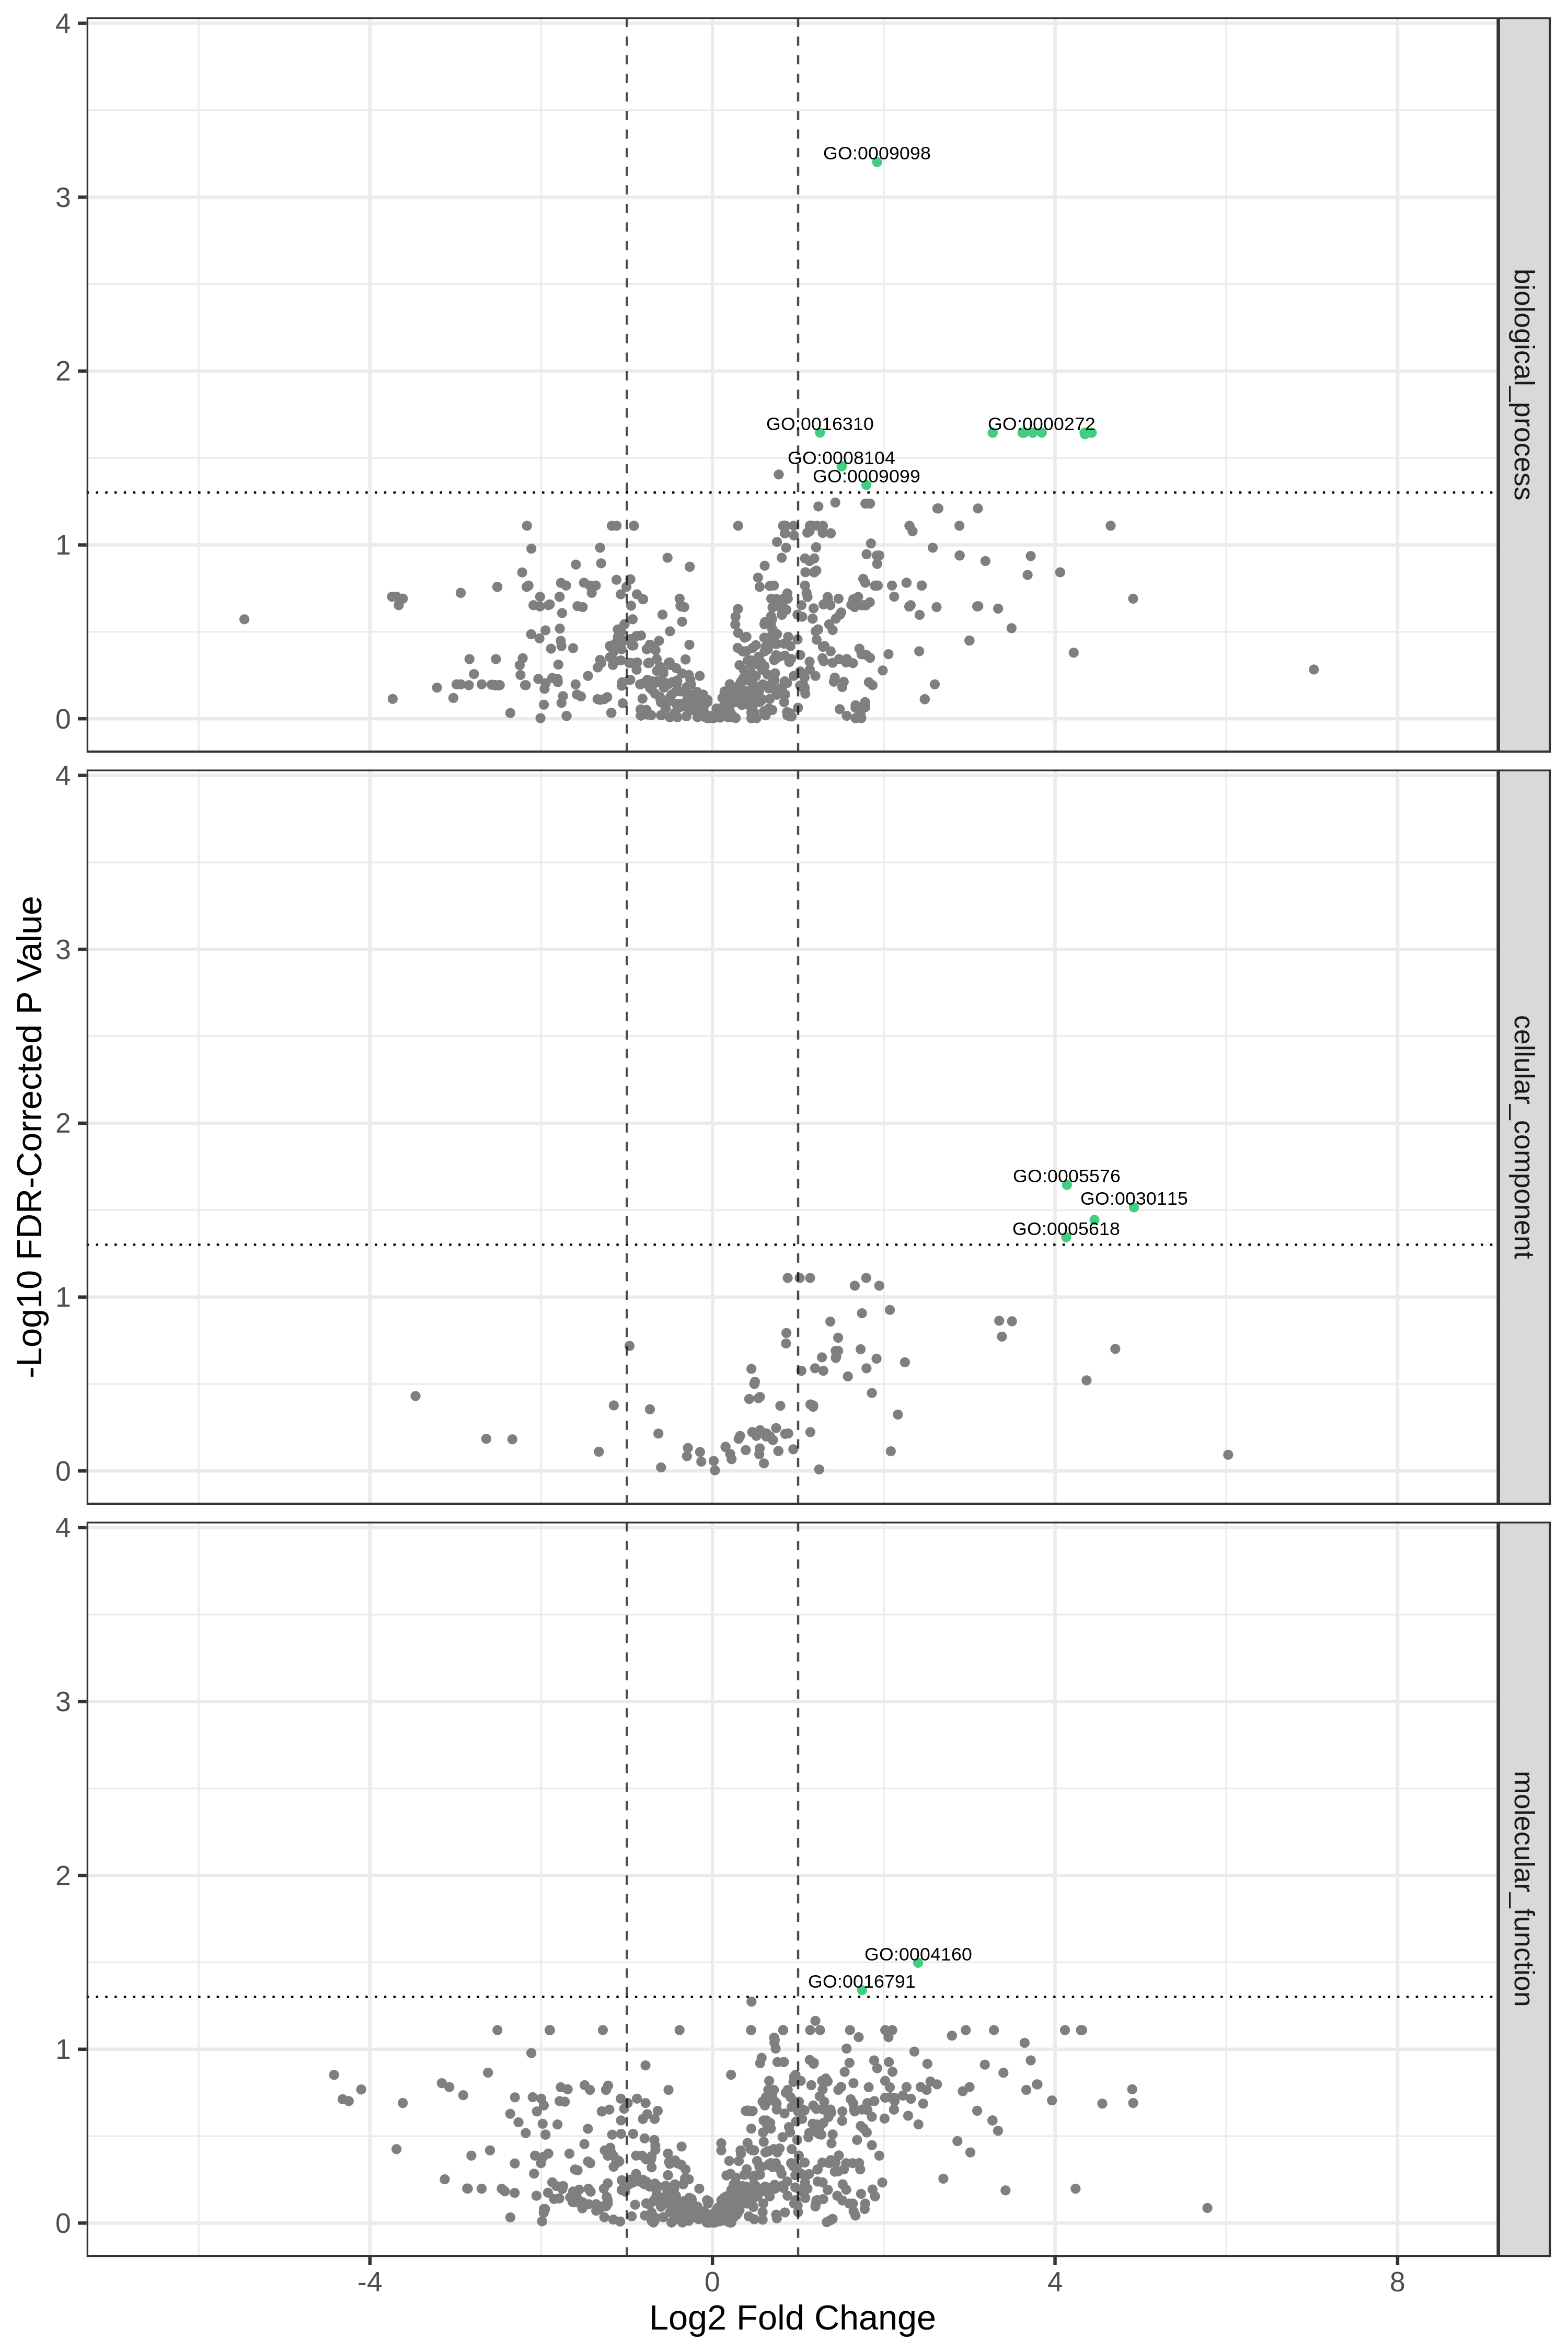
Hands On: Volcano Plot visualization of the data T7 and T2.
- metaQuantome: visualize ( Galaxy version 2.0.0-0) with the following parameters:
- param-file “Tabular file from metaQuantome stats or metaQuantome filter”:
metaQuantome:stat(output of metaQuantome: stat tool)- param-file “Samples file”:
metaQuantome:create samples_file(output of metaQuantome: create samples file tool)- “Mode”:
Functional analysis
- “Plot type”:
Volcano Plot (volcano)
- “Name of the fold change column in the stat dataframe”:
log2fc_T7_over_T2- “Name of the Corrected p-value column in the stat dataframe”:
corrected_p_T7_over_T2- “Name of the annotation column”:
id- param-select “Flip the fold change (i.e., multiply log fold change by -1)”:
No- param-select “Make one plot for each of BiologicalProcess, CellularComponent, and MolecularFunction GO term categories”:
YesCommentHere, we show metaQuantome’s Functional differential abundance volcano plot. The user may select the significance threshold (0.05 by default), and terms with statistically significant fold changes are colored green and labeled. However, we can currently only compare two conditions at a time. Here we have compared T7 and T2 time points.
 Open image in new tab
Question
- Can we choose to Flip the fold change?
- Could we create a single volcano plot for all the functions than splitting into different categories?
- Certainly, the user has the ability to flip the fold changes.
- Yes, the Go term that passes the threshold value will be represented in green. The user can then find out from the tabular output which category the GO term belonged to.
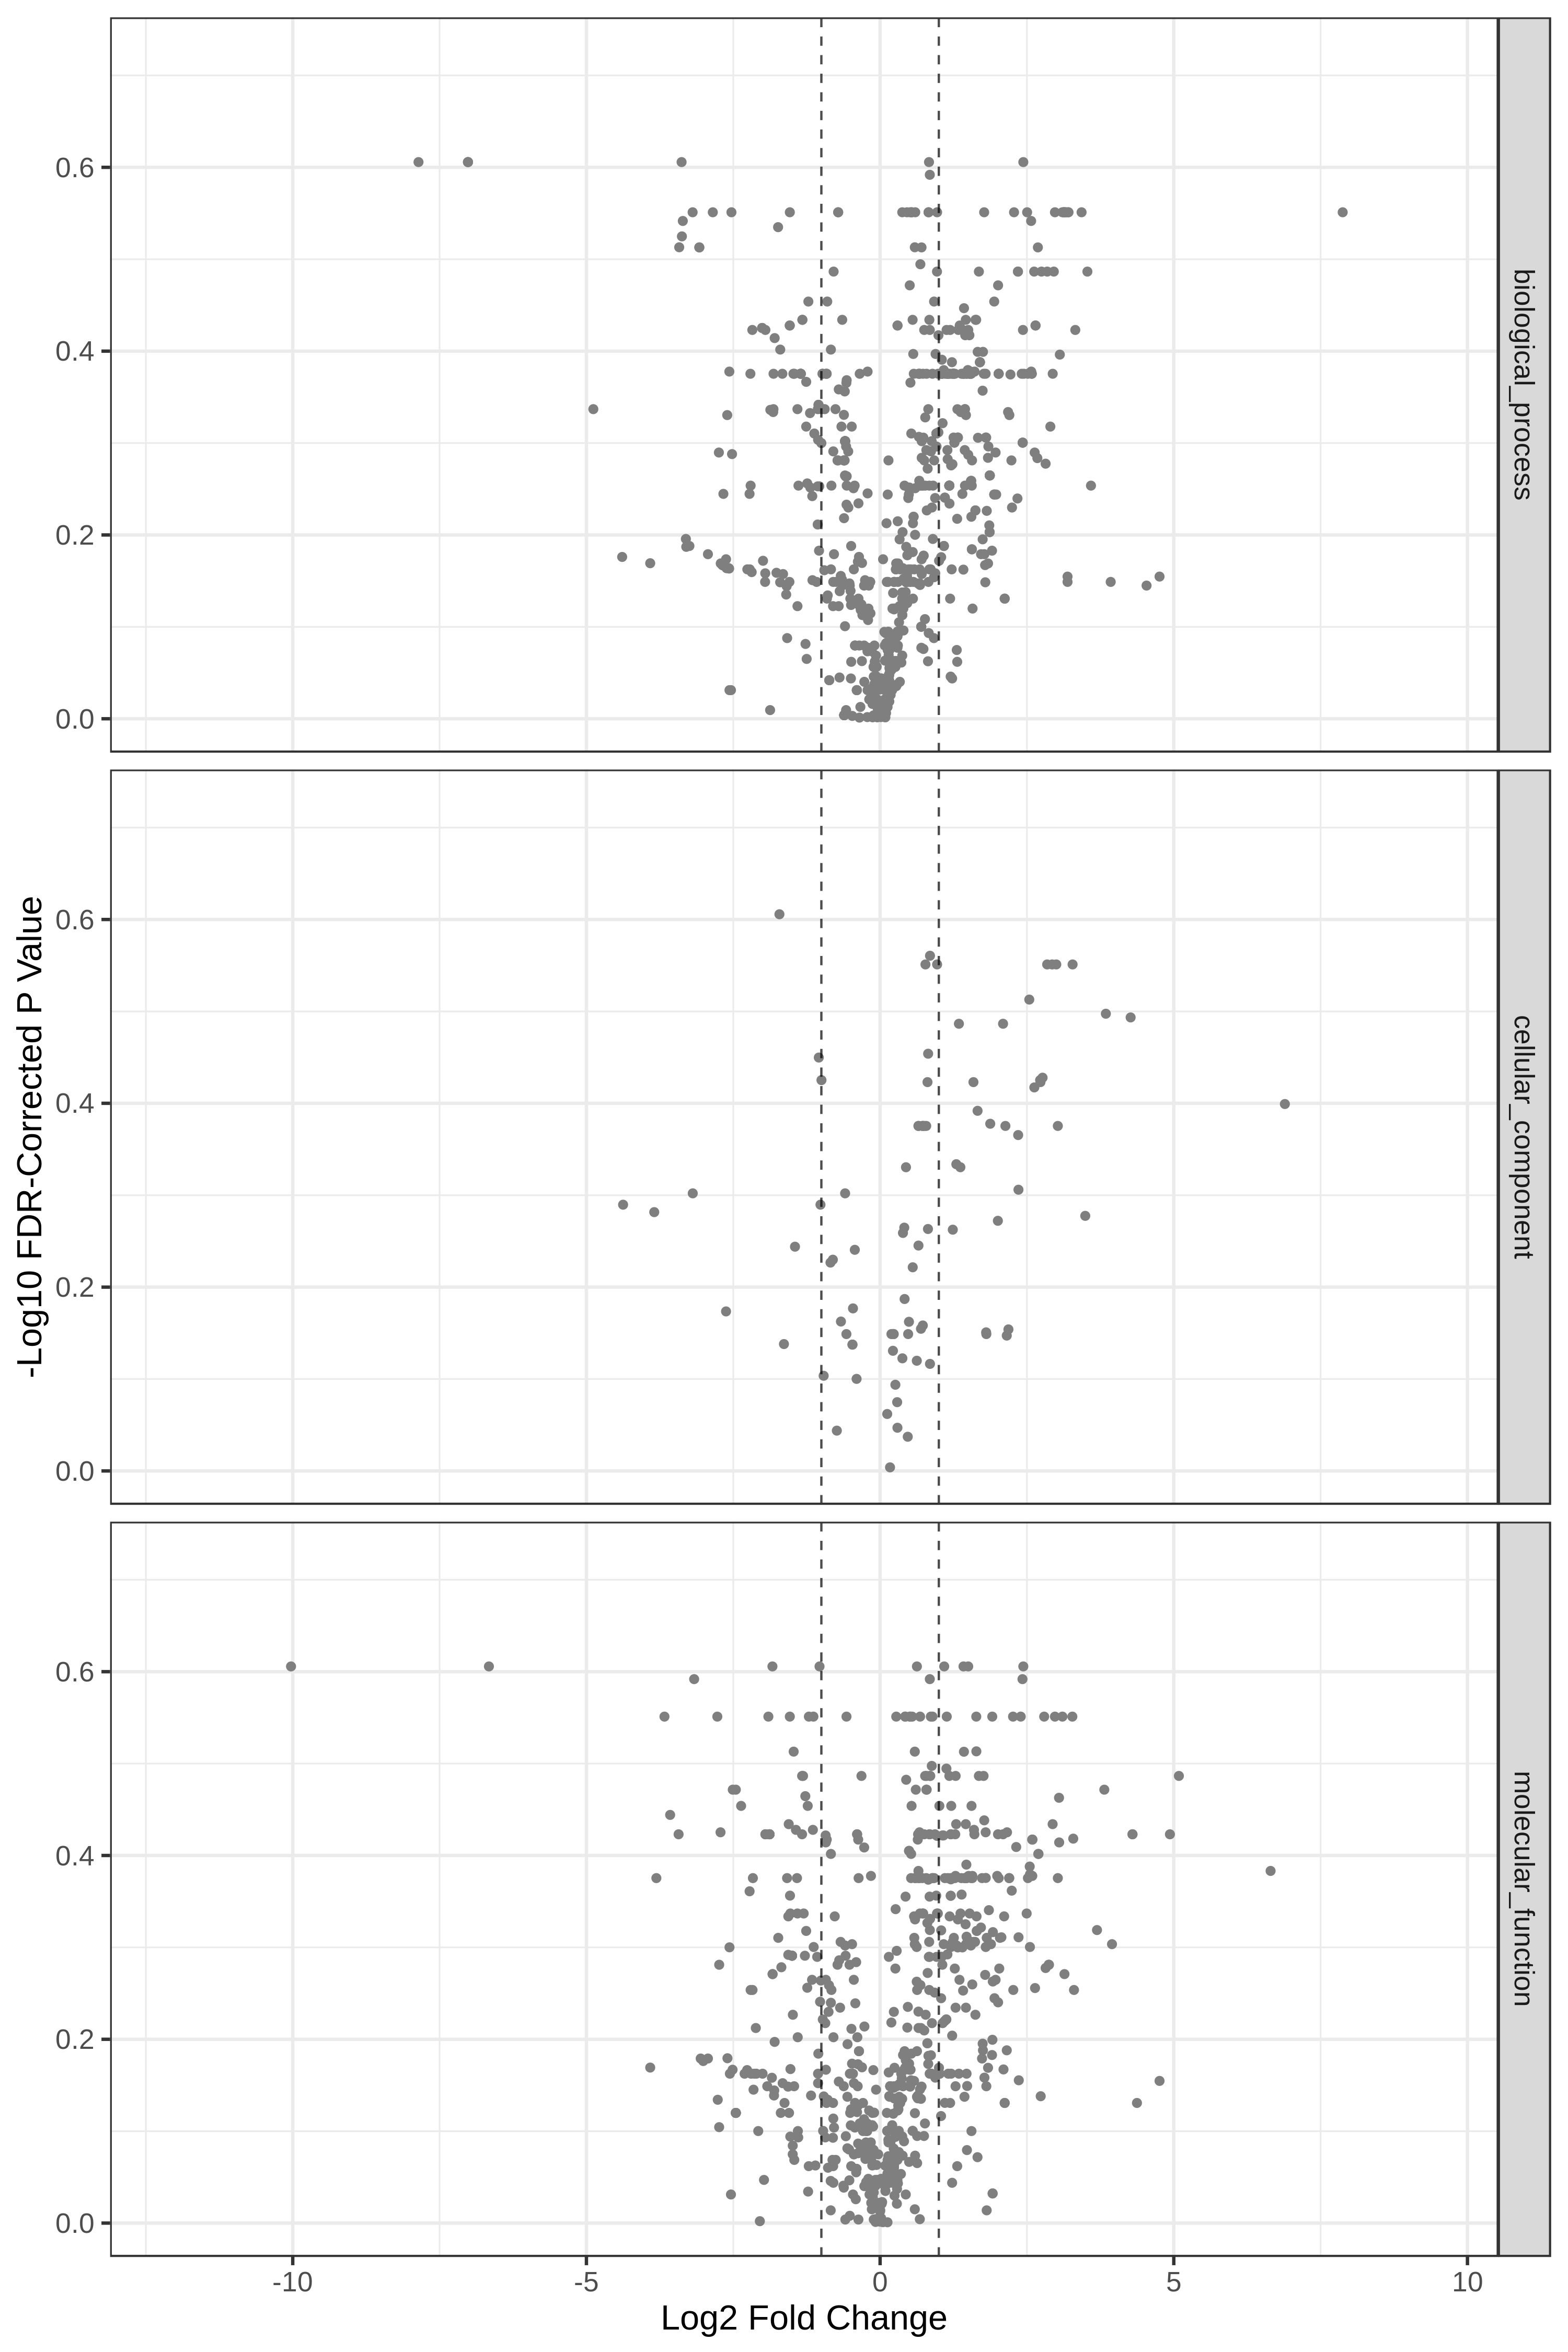
Hands On: Volcano Plot visualization of the data T4 and T2.
- metaQuantome: visualize ( Galaxy version 2.0.0-0) with the following parameters:
- param-file “Tabular file from metaQuantome stats or metaQuantome filter”:
metaQuantome:stat(output of metaQuantome: stat tool)- param-file “Samples file”:
metaQuantome:create samples_file(output of metaQuantome: create samples file tool)- “Mode”:
Functional analysis
- “Plot type”:
Volcano Plot (volcano)
- “Name of the fold change column in the stat dataframe”:
log2fc_T4_over_T2- “Name of the Corrected p-value column in the stat dataframe”:
corrected_p_T4_over_T2- “Name of the annotation column”:
id- param-select “Flip the fold change (i.e., multiply log fold change by -1)”:
No- param-select “Make one plot for each of BiologicalProcess, CellularComponent, and MolecularFunction GO term categories”:
Yes
 Open image in new tab
Conclusion
This completes the walkthrough of the metaQuantome function workflow. This tutorial is a guide to run the metaQuantome modules and can be used for metaproteomics research. Here, we have incorporated only two visualization modules in this workflow but we will make the heatmap and PCA plot also available. Researchers can use this workflow with their data also, please note that the tool parameters and the workflow will be needed to be modified accordingly. Also, refer to the metaQuantome data creation workflow to understand how to make files metaQuantome compatible.
This workflow was developed by the Galaxy-P team at the University of Minnesota. For more information about Galaxy-P or our ongoing work, please visit us at galaxyp.org
You've Finished the Tutorial
Key points
All the inputs should have one column in common i.e. peptides.
Functional annotation can be performed using GO terms and EC numbers
Having basic knowledge regarding tools that can perform functional annotation can come in handy
Frequently Asked Questions
Have questions about this tutorial? Have a look at the available FAQ pages and support channelsUseful literature
Further information, including links to documentation and original publications, regarding the tools, analysis techniques and the interpretation of results described in this tutorial can be found here.
References
- Easterly, C. W., R. Sajulga, S. Mehta, J. Johnson, P. Kumar et al., 2019 metaQuantome: An Integrated, Quantitative Metaproteomics Approach Reveals Connections Between Taxonomy and Protein Function in Complex Microbiomes. Molecular & Cellular Proteomics 18: S82–S91. 10.1074/mcp.ra118.001240
- Delogu, F., B. J. Kunath, P. N. Evans, M. Ø. Arntzen, T. R. Hvidsten et al., 2020 Integration of absolute multi-omics reveals dynamic protein-to-RNA ratios and metabolic interplay within mixed-domain microbiomes. Nature Communications 11: 10.1038/s41467-020-18543-0
- Team, G.-P. Galaxy-P. http://galaxyp.org/
Feedback
Did you use this material as an instructor? Feel free to give us feedback on how it went.
Did you use this material as a learner or student? Click the form below to leave feedback.

Citing this Tutorial
- Subina Mehta, Timothy J. Griffin, Pratik Jagtap, Emma Leith, Marie Crane, Praveen Kumar, metaQuantome 2: Function (Galaxy Training Materials). https://training.galaxyproject.org/training-material/topics/proteomics/tutorials/metaquantome-function/tutorial.html Online; accessed TODAY
- Hiltemann, Saskia, Rasche, Helena et al., 2023 Galaxy Training: A Powerful Framework for Teaching! PLOS Computational Biology 10.1371/journal.pcbi.1010752
- Batut et al., 2018 Community-Driven Data Analysis Training for Biology Cell Systems 10.1016/j.cels.2018.05.012
Congratulations on successfully completing this tutorial!@misc{proteomics-metaquantome-function, author = "Subina Mehta and Timothy J. Griffin and Pratik Jagtap and Emma Leith and Marie Crane and Praveen Kumar", title = "metaQuantome 2: Function (Galaxy Training Materials)", year = "", month = "", day = "", url = "\url{https://training.galaxyproject.org/training-material/topics/proteomics/tutorials/metaquantome-function/tutorial.html}", note = "[Online; accessed TODAY]" } @article{Hiltemann_2023, doi = {10.1371/journal.pcbi.1010752}, url = {https://doi.org/10.1371%2Fjournal.pcbi.1010752}, year = 2023, month = {jan}, publisher = {Public Library of Science ({PLoS})}, volume = {19}, number = {1}, pages = {e1010752}, author = {Saskia Hiltemann and Helena Rasche and Simon Gladman and Hans-Rudolf Hotz and Delphine Larivi{\`{e}}re and Daniel Blankenberg and Pratik D. Jagtap and Thomas Wollmann and Anthony Bretaudeau and Nadia Gou{\'{e}} and Timothy J. Griffin and Coline Royaux and Yvan Le Bras and Subina Mehta and Anna Syme and Frederik Coppens and Bert Droesbeke and Nicola Soranzo and Wendi Bacon and Fotis Psomopoulos and Crist{\'{o}}bal Gallardo-Alba and John Davis and Melanie Christine Föll and Matthias Fahrner and Maria A. Doyle and Beatriz Serrano-Solano and Anne Claire Fouilloux and Peter van Heusden and Wolfgang Maier and Dave Clements and Florian Heyl and Björn Grüning and B{\'{e}}r{\'{e}}nice Batut and}, editor = {Francis Ouellette}, title = {Galaxy Training: A powerful framework for teaching!}, journal = {PLoS Comput Biol} }
Do you want to extend your knowledge?Follow one of our recommended follow-up trainings:
You can use Ephemeris's
shed-tools installcommand to install the tools used in this tutorial.shed-tools install [-g GALAXY] [-a API_KEY] -t <(curl https://training.galaxyproject.org/training-material/api/topics/proteomics/tutorials/metaquantome-function/tutorial.json | jq .admin_install_yaml -r)Alternatively you can copy and paste the following YAML
---
install_tool_dependencies: true
install_repository_dependencies: true
install_resolver_dependencies: true
tools:
- name: metaquantome_db
  owner: galaxyp
  revisions: 7c45aa1c9464
  tool_panel_section_label: Proteomics
  tool_shed_url: https://toolshed.g2.bx.psu.edu/
- name: metaquantome_db
  owner: galaxyp
  revisions: e63db1aa82ee
  tool_panel_section_label: Proteomics
  tool_shed_url: https://toolshed.g2.bx.psu.edu/
- name: metaquantome_expand
  owner: galaxyp
  revisions: eb65ab160a10
  tool_panel_section_label: Proteomics
  tool_shed_url: https://toolshed.g2.bx.psu.edu/
- name: metaquantome_expand
  owner: galaxyp
  revisions: 767c1d761aaf
  tool_panel_section_label: Proteomics
  tool_shed_url: https://toolshed.g2.bx.psu.edu/
- name: metaquantome_filter
  owner: galaxyp
  revisions: 7d1c20b315ff
  tool_panel_section_label: Proteomics
  tool_shed_url: https://toolshed.g2.bx.psu.edu/
- name: metaquantome_filter
  owner: galaxyp
  revisions: 35cc7ca0bdc7
  tool_panel_section_label: Proteomics
  tool_shed_url: https://toolshed.g2.bx.psu.edu/
- name: metaquantome_sample
  owner: galaxyp
  revisions: 49a957fb353a
  tool_panel_section_label: Proteomics
  tool_shed_url: https://toolshed.g2.bx.psu.edu/
- name: metaquantome_sample
  owner: galaxyp
  revisions: 06f6826d380c
  tool_panel_section_label: Proteomics
  tool_shed_url: https://toolshed.g2.bx.psu.edu/
- name: metaquantome_stat
  owner: galaxyp
  revisions: 982a442a98dd
  tool_panel_section_label: Proteomics
  tool_shed_url: https://toolshed.g2.bx.psu.edu/
- name: metaquantome_stat
  owner: galaxyp
  revisions: b9d453dca8d3
  tool_panel_section_label: Proteomics
  tool_shed_url: https://toolshed.g2.bx.psu.edu/
- name: metaquantome_viz
  owner: galaxyp
  revisions: 02da24eac445
  tool_panel_section_label: Proteomics
  tool_shed_url: https://toolshed.g2.bx.psu.edu/
- name: metaquantome_viz
  owner: galaxyp
  revisions: 8bd7734309f6
  tool_panel_section_label: Proteomics
  tool_shed_url: https://toolshed.g2.bx.psu.edu/