DIA Analysis using OpenSwathWorkflow
| Author(s) |
|
| Reviewers |
|
OverviewQuestions:
Objectives:
How to analyze data independent acquisition (DIA) mass spectrometry (MS) data using OpenSwathWorkflow?
How to detect different Spike-in amounts of Ecoli in a HEK-Ecoli Benchmark DIA dataset?
Requirements:
Analysis of HEK-Ecoli Spike-in DIA data in Galaxy
Understanding DIA data principles and characteristics
Using OpenSwathworkflow to analyze HEK-Ecoli Spike-in DIA data
Time estimation: 2 hoursLevel: Intermediate IntermediateSupporting Materials:Published: Dec 2, 2020Last modification: May 20, 2025License: Tutorial Content is licensed under Creative Commons Attribution 4.0 International License. The GTN Framework is licensed under MITpurl PURL: https://gxy.io/GTN:T00211version Revision: 12
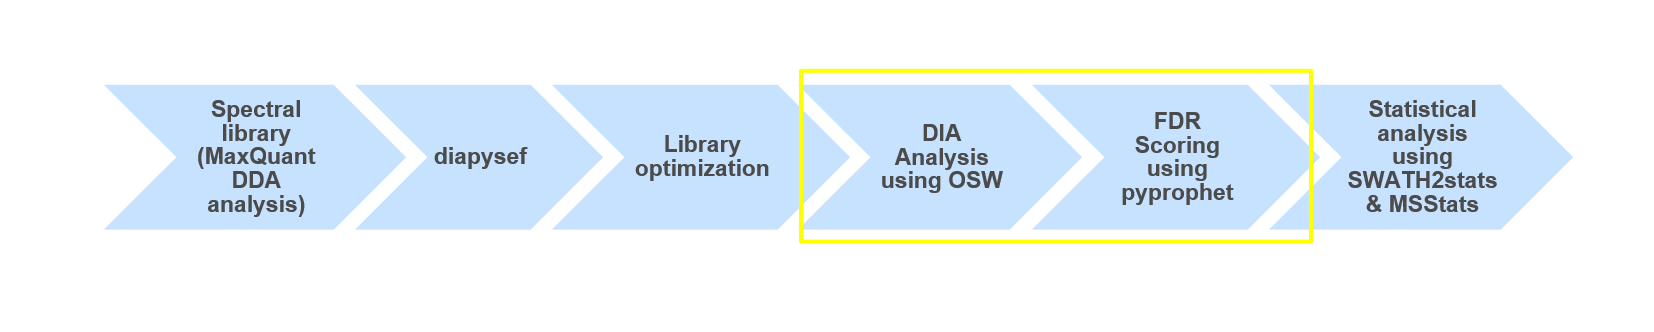
This training covers data independent acquisition (DIA) mass spectrometry (MS) applying spectral libraries for peptide identification and quantification. You can learn how to prepare and optimize a spectral library for the analysis of DIA data in theDIA library generation tutorial.
The proteome refers to the entirety of proteins in a biological system (e.g cell, tissue, organism). Proteomics is the large-scale experimental analysis of proteins and proteomes, most often performed by mass spectrometry that enables great sensitivity and throughput. Especially for complex protein mixtures, bottom-up mass spectrometry is the standard approach. In bottom-up proteomics, proteins are digested with a specific protease into peptides and the measured peptides are in silico reassembled into the corresponding proteins. Inside the mass spectrometer, not only the peptides are measured (MS1 level), but the peptides are also fragmented into smaller peptides which are measured again (MS2 level). This is referred to as tandem-mass spectrometry (MS/MS). Identification of peptides is performed by peptide spectrum matching of the theoretical spectra generated from the input protein database (fasta file) with the measured MS2 spectra. Peptide quantification is most often performed by measuring the area under the curve of the MS1 level peptide peaks, but special techniques such as TMT allow to quantify peptides on MS2 level. Nowadays, bottom-up tandem-mass spectrometry approaches allow for the identification and quantification of several thousand proteins.
In clinical proteomic studies often two or more conditions should be compared against each other, thus focusing on the proteins which were found in all conditions. Using the data dependent acquisition (DDA) approach could lead to limited numbers of cumulative proteins, due to method instrinsic dependencies (e.g. if the same peptides is selected for fragmentation in all measurements). Over the last decade another acquisition method has been developed addressing the urgent need for increased cumulatively identified and quantified peptides and proteins across multiple measurements (Ludwig et al. 2018). The so called data independent acquisition (DIA) circumvents the time and abundance dependent selection for fragmentation by using predefined fragmentation windows (m/z windows) going through the whole m/z range of the previous MS1 scan.
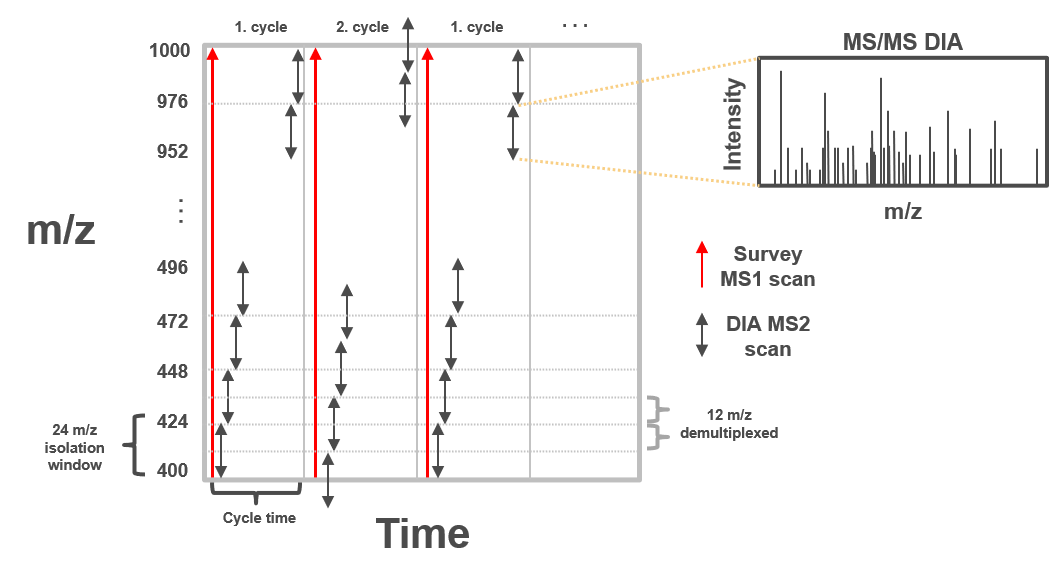 Open image in new tab
Therefore, all peptides which are present in the same m/z window at the same time are fragmented simultaneously and a MS2 spectra containing fragments from multiple peptides is acquired. Using the same m/z windows for all measurements, results in more reproducible fragmentation and potential identification across multiple measurements. However, the resulting MS2 spectra contain fragments from multiple peptides and are often more complex and do not allow to directly link a specific (m/z) mass from the MS1 to a single MS2 fragment spectra.
 Open image in new tab
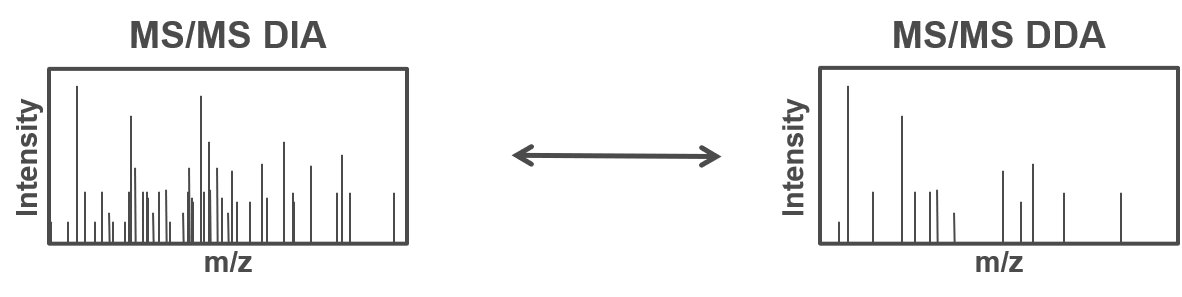
To allow for the identification of peptides in those ambiguous MS2 spectra, a spectral library can be used. The spectral library contains experimentally measured MS2 spectra, which are specific for one precursor (from previous DDA measurements). In more recent approaches the MS2 spectra can be predicted based on theoretical peptide sequences (e.g. from a protein database).
 Open image in new tab
One of the open-source software options for DIA data analysis is OpenSwath (Röst et al. 2014), which requires a spectral library, retention time alignment peptides as well as the DIA MS data.
The dataset in this tutorial consists of two different Spike-in mixtures of human and Ecoli peptides, with an increase of the Ecoli peptides in one of the Spike-ins. For each Spike-in there a four replicate measurements to allow for statistical analysis later on. Here we will go through the data analysis of DIA mass spectrometry data and will get first impressions on which of the Spike-ins might contain higher amounts of Ecoli peptides.
AgendaIn this tutorial, we will cover:
Get data
Hands On: Data upload
Create a new history for this tutorial and give it a meaningful name
To create a new history simply click the new-history icon at the top of the history panel:
- Import the fasta and raw files as well as the sample annotation and the iRT Transition file from Zenodo iRT Transition file contains information about the transitions of the Indexed Retention Time (iRT) standard peptides. These peptides are a set of synthetic peptides with well-defined and stable retention times across different liquid chromatography-mass spectrometry (LC-MS) systems.
https://zenodo.org/record/4307762/files/HEK_Ecoli_lib.pqp
https://zenodo.org/record/4307762/files/iRTassays.tsv
https://zenodo.org/record/4307762/files/Sample_annotation.txt
https://zenodo.org/record/4307762/files/Sample1.raw
https://zenodo.org/record/4307762/files/Sample2.raw
https://zenodo.org/record/4307762/files/Sample3.raw
https://zenodo.org/record/4307762/files/Sample4.raw
https://zenodo.org/record/4307762/files/Sample5.raw
https://zenodo.org/record/4307762/files/Sample6.raw
https://zenodo.org/record/4307762/files/Sample7.raw
https://zenodo.org/record/4307762/files/Sample8.raw
- Copy the link location
Click galaxy-upload Upload at the top of the activity panel
- Select galaxy-wf-edit Paste/Fetch Data
Paste the link(s) into the text field
Press Start
- Close the window
Once the files are green, rename the sample annotation file in ‘Sample_annotation’, the spectral library in ‘HEK_Ecoli_lib’, the iRT transition file in ‘iRTassays’ and the raw files in ‘Sample1.raw’, ‘Sample2.raw’, ‘Sample3.raw’, ‘Sample4.raw’, ‘Sample5.raw’, ‘Sample6.raw’, ‘Sample7.raw’ and ‘Sample8.raw’
- Click on the galaxy-pencil pencil icon for the dataset to edit its attributes
- In the central panel, change the Name field
- Click the Save button
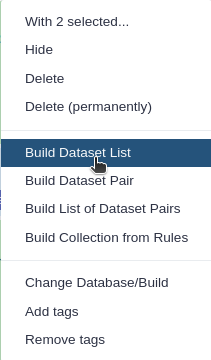
Generate a collection for all .raw files (and name it DIA_data)
- Click on galaxy-selector Select Items at the top of the history panel
- Check all the datasets in your history you would like to include
Click n of N selected and choose Advanced Build List
You are in collection building wizard. Choose Flat List and click ‘Next’ button at the right bottom corner.
Double clcik on the file names to edit. For example, remove file extensions or common prefix/suffixes to cleanup the names.
- Enter a name for your collection
- Click Build to build your collection
- Click on the checkmark icon at the top of your history again


raw File conversion with msconvert
Hands On: Converting vendor specific raw to open mzML format
- msconvert Convert and/or filter mass spectrometry files ( Galaxy version 3.0.20287.6)
- param-collection “Input unrefined MS data”:
DIA_data- “Do you agree to the vendor licenses?”:
Yes- “Output Type”:
mzML- In “Data Processing Filters”:
- “Apply peak picking?”:
Yes- “Demultiplex overlapping or MSX spectra”:
Yes
- “Optimization”:
Overlap only- In “General Options”:
- “SIM as Spectra”:
Yes- “Ignore unknown instrument error”:
Yes- In “Output Encoding Settings”:
- “Intensity Encoding Precision”:
64Comment: DemultiplexingDemultiplexing is needed when the MS2 m/z windows of consecutive scan cycles are overlapping e.g. for the staggered approach (50% shift between the cycles).
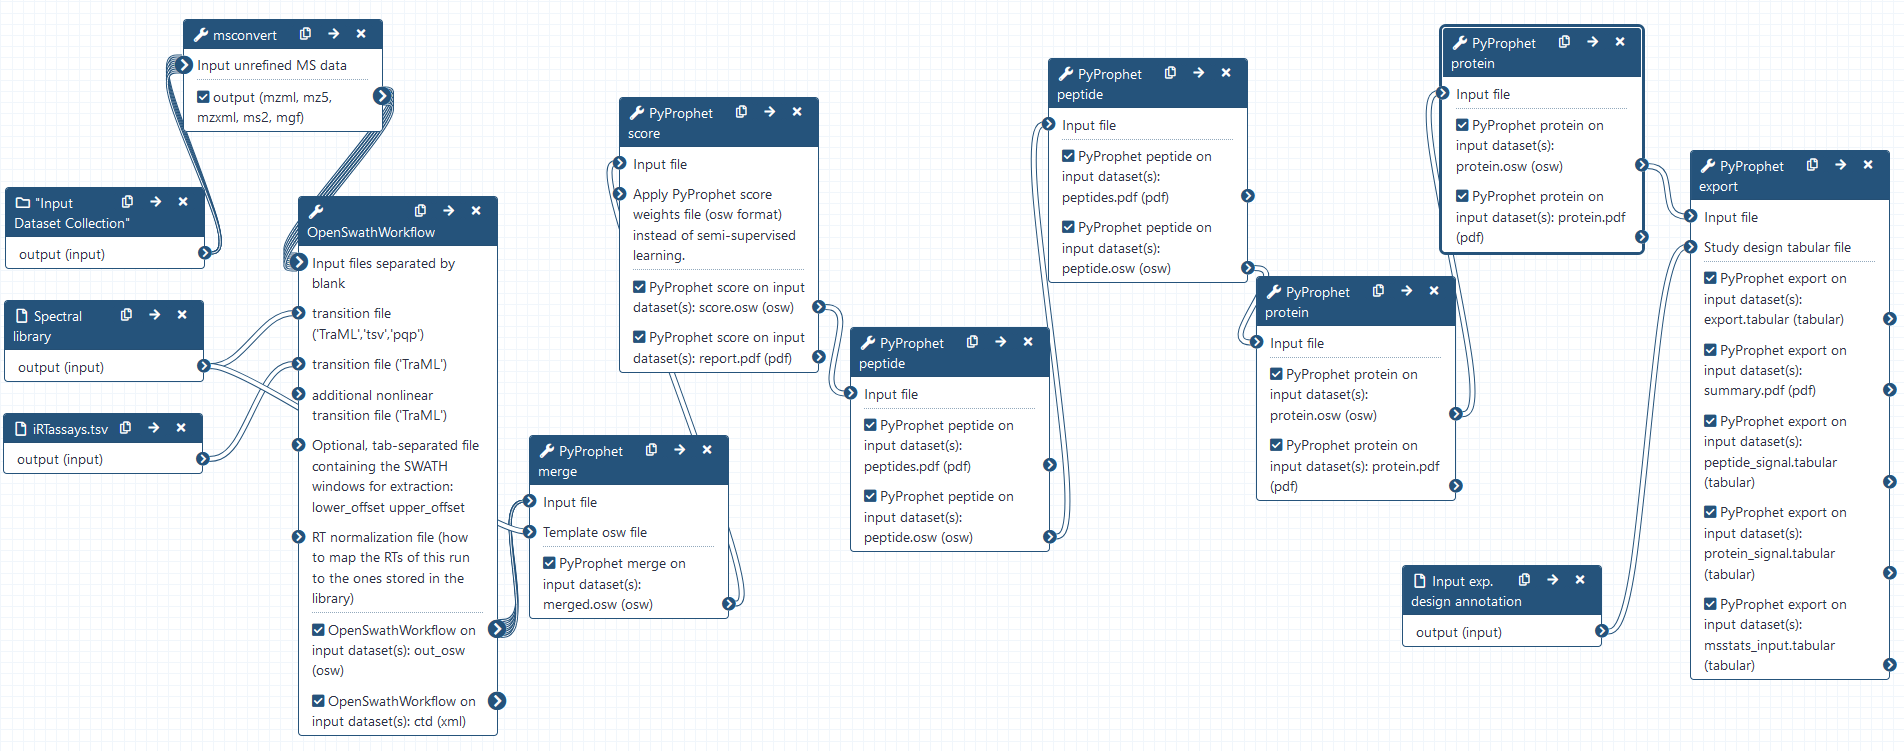
DIA analysis using OpenSwathWorkflow
Hands On: DIA analysis using OpenSwathWorkflow
- OpenSwathWorkflow Complete workflow to run OpenSWATH ( Galaxy version 3.1+galaxy0)
- param-collection “Input files separated by blank”:
DIA_data(output of msconvert tool)- param-file “transition file (‘TraML’,’tsv’,’pqp’)”:
HEK_Ecoli_lib- param-file “transition file (‘TraML’)”:
iRTassays- “Extraction window in Thomson or ppm (see mz_extraction_window_unit)”:
10.0- “Extraction window used in MS1 in Thomson or ppm (see mz_extraction_window_ms1_unit)”:
10.0- In “Parameters for the RTNormalization for iRT petides”:
- “Which outlier detection method to use (valid: ‘iter_residual’, ‘iter_jackknife’, ‘ransac’, ‘none’)”:
none- “Whether the algorithms should try to choose the best peptides based on their peak shape for normalization”:
Yes- “Minimal number of bins required to be covered”:
7- In “Scoring parameters section”:
- In “TransitionGroupPicker”:
- “Minimal peak width (s), discard all peaks below this value (-1 means no action)”:
5.0- “Tries to compute a quality value for each peakgroup and detect outlier transitions”:
Yes- In “Scores”:
- “Use the MI (mutual information) score”:
No- “Advanced Options”:
Show Advanced Options
- “Output an XIC with a RT-window by this much large”:
100.0- “Extraction window used for iRT and m/z correction in Thomson or ppm (see irt_mz_extraction_window_unit)”:
10.0- “Whether to run OpenSWATH directly on the input data, cache data to disk first or to perform a datareduction step first”:
cacheWorkingInMemory- “Use the retention time normalization peptide MS2 masses to perform a mass correction (linear, weighted by intensity linear or quadratic) of all spectra”:
regression_delta_ppm- “Optional outputs”:
out_oswComment: Mass tolerances and "Minimal number of bins required to be covered"Here we analyze data acquired on a QExactive Plus MS instrument which uses an Orbitrap and generates high resolution data. Therefore, we allow for 10 ppm mass tolerance for both the MS1 and the MS2 level. If larger mass deviation are expected the mass tolerances can be adjusted. Other instrumentation (such as TOF devices) might require larger mass tolerances for improved peptide identification. Furthermore, here we require at least 7 of the iRT peptides to be found in each of the DIA measurements. This number can be set to lower values if for some reasons fewer iRT peptides were found in some of the measurements. In case only a few iRT peptides are identified in the DIA measurements, the mass tolerance for the iRT extraction can be increased to 20 ppm. We then recommend to increase the extraction window for the MS2 level to 20 ppm. For more information see also OpenSwathWorkflow.
Combining osw results using PyProphet merge
Hands On: Combining the individual osw results with pyprophet merge
- PyProphet merge Merge multiple osw files ( Galaxy version 2.1.4.0)
- param-collection “Input file”:
out_osw(output of OpenSwathWorkflow tool)- param-file “Template osw file”:
HEK_Ecoli_lib
FDR estimation using PyProphet score
Hands On: Semi-supervised learning and scoring of OpenSwathWorkflow results
- PyProphet score Error-rate estimation for MS1, MS2 and transition-level data ( Galaxy version 2.1.4.2)
- param-file “Input file”:
merged.osw(output of PyProphet merge tool)- “Either a ‘LDA’ or ‘XGBoost’ classifier is used for semi-supervised learning”:
XGBoostComment: FDR scoring using pyprophet scoreDuring this step q-values corresponding to the FDR of peak identification is estimated with pyprophet. Typically this is the most time consuming step due to the involved machine learning processes. To decrease the input size one can use PyProphet subsample to randomly select subsets of the identifications from each run in the merged.osw (PyProphet merge output). In this case, the FDR estimation needs to be applied on the full merged.osw afterwards using the scored subsample.osw in the “Apply PyProphet score weights file (osw format) instead of semi-supervised learning.” section of PyProphet score. The generated report.pdf is helpful to identify potential errors as well as get first insights on the quality of the identifications.
In case the pyprophet score run is not yet finished, the results can be downloaded from Zenodo to be able to continue the tutorial
- Import the files from Zenodo
https://zenodo.org/record/4307762/files/PyProphet_score_report.pdf
https://zenodo.org/record/4307762/files/PyProphet_score.osw
Question
- Does the distribution of target identifications differ from the decoy distribution?
- Is the observed distribution of decoy and target identifications expected?
- Yes, we can see a clearly different distribution of the target identification and the decoys. Both, target and decoy distribution were highest around 0. However, the target distribution shows a second peak at positive d-score values.
- The decoy identifications show a Gaussian distribution around 0 which could be explained by the fact that the decoy sequences were randomly generated alterations from the target sequences in the spectral library (see DIA library generation tutorial). Most target identifications show also d-scores around 0, thus reflect potential false positive identifications. Only the distribution of target identifications shows a second increase in higher d-score values, representing more confident identifications.
Apply scores with PyProphet peptide
Hands On: Conduct peptide inference in experiment-wide and global context
- PyProphet peptide Peptide error-rate estimation ( Galaxy version 2.1.4.0)
- param-file “Input file”:
score.osw(output of PyProphet score tool)- “Context to estimate protein-level FDR control”:
experiment-wide- PyProphet peptide Peptide error-rate estimation ( Galaxy version 2.1.4.0)
- param-file “Input file”:
peptide.osw(output of PyProphet peptide tool)- “Context to estimate protein-level FDR control”:
global
Apply scores with PyProphet protein
Hands On: Conduct protein inference in experiment-wide and global context
- PyProphet protein Protein error-rate estimation ( Galaxy version 2.1.4.0)
- param-file “Input file”:
peptide.osw(output of the second PyProphet peptide tool)- “Context to estimate protein-level FDR control”:
experiment-wide- PyProphet protein Protein error-rate estimation ( Galaxy version 2.1.4.0)
- param-file “Input file”:
protein.osw(output of PyProphet protein tool)- “Context to estimate protein-level FDR control”:
global
Question
- How does the score distribution differ between the peptide and the protein inference (in global context)?
- What could be the reason for this difference?
- The d-score distribution and the ROC curve for the protein inference shows better target decoy discriminatory ability than for the peptide inference.
- The probabilty of multiple decoy peptides from the same protein having a high score is lower than for multiple target peptides from the same protein. Thus, the discriminatory scores on protein level are higher.
Exporting the results with PyProphet export
Hands On: Exporting pyprophet scored OSW results
- PyProphet export Export tabular files, optional swath2stats export ( Galaxy version 2.1.4.1)
- param-file “Input file”:
protein.osw(output of the second PyProphet protein tool)- “Export format, either matrix, legacy_split, legacy_merged (mProphet/PyProphet) or score_plots format”:
legacy_merged- “Use swath2stats to export file for statsics”:
yes
- param-file “Study design tabular file”:
Sample_annotationComment: PyProphet export and the swath2stats functionalityAll previous FDR scoring steps using PyProphet peptide and PyProphet protein are integrated in the respective
.oswoutput. Therefore, the latestprotein.oswcan be used for the export step. If peptide and protein FDR scoring was performed in the global context, the exported results will be filtered to 1% FDR by default. For more information see also PyProphet. Utilizing the swath2stats functionality generates a summary as well as a peptide and protein expression matrix. In addition to the non-processed pyprophet tabular output a refined tabular is generated using the specified criteria. The refined tabularmsstats_input.tabularis dircetly compatable with MSstats for statistical analysis. The integration of swath2stats also allows to adjust the processing by applying different FFT and FDR settings as well as specifying a minimum number of peptides per protein. For more information see also Swath2stats.
Question
- How many different peptides and proteins were identified and quantified?
- Could you already tell from the summary which Spike-in contained higher amounts of Ecoli peptides?
- In total, over 28,041 peptides and over 5,056 proteins were identified and quantified in the DIA measurements.
- No, the summary mainly provides an overview of the identifications in each individual DIA measurement as well as some descriptive statistics such as CVs and correlations.
Hands On: Analysis of Ecoli Spike-in
- Select lines that match an expression
- param-file “Select lines from”:
protein_signal.tabular(output of PyProphet export tool)- “that”:
Matching- “the pattern”:
(ECOLI)|(Spike_in)
Question
- How many Ecoli proteins were identified and quantified in the six DIA measurements?
- Can you guess which Spike-in contains higher amounts of Ecoli peptides?
- Over 817 Ecoli proteins were identified and quantified in the six DIA measurements.
- It seems that the samples in Spike_in_2 contained higher amounts of Ecoli peptides than the samples in Spike_in_1.
Conclusion
 Open image in new tab
Using OpenSwathWorkflow and a spectral library (from DDA data) we were able to analyze data independent acquisition (DIA) data. Furthermore, we were able to process the FDR scored results and take a guess on which Spike-in contained higher amounts of Ecoli. To further investigate the two different Spike-in amounts as well as getting a significant result we would need to perform statistical analysis e.g. using MSstats.
 Open image in new tab
You've Finished the Tutorial
Key points
OpenSwathWorkflow enables analysis of data independent acquisition mass spectrometry data
DIA data analysis of HEK-Ecoli Spike-in dataset
Frequently Asked Questions
Have questions about this tutorial? Have a look at the available FAQ pages and support channelsUseful literature
Further information, including links to documentation and original publications, regarding the tools, analysis techniques and the interpretation of results described in this tutorial can be found here.
References
- Röst, H. L., G. Rosenberger, P. Navarro, L. Gillet, S. M. Miladinović et al., 2014 OpenSWATH enables automated, targeted analysis of data-independent acquisition MS data. Nature biotechnology 32: 219–23. 10.1038/nbt.2841 http://www.ncbi.nlm.nih.gov/pubmed/24727770 ISBN: 1087-0156
- Ludwig, C., L. Gillet, G. Rosenberger, S. Amon, B. C. Collins et al., 2018 Data‐independent acquisition‐based SWATH ‐ MS for quantitative proteomics: a tutorial . Molecular Systems Biology 14: 1–23. 10.15252/msb.20178126
Feedback
Did you use this material as an instructor? Feel free to give us feedback on how it went.
Did you use this material as a learner or student? Click the form below to leave feedback.

Citing this Tutorial
- Matthias Fahrner, Melanie Föll, DIA Analysis using OpenSwathWorkflow (Galaxy Training Materials). https://training.galaxyproject.org/training-material/topics/proteomics/tutorials/DIA_Analysis_OSW/tutorial.html Online; accessed TODAY
- Hiltemann, Saskia, Rasche, Helena et al., 2023 Galaxy Training: A Powerful Framework for Teaching! PLOS Computational Biology 10.1371/journal.pcbi.1010752
- Batut et al., 2018 Community-Driven Data Analysis Training for Biology Cell Systems 10.1016/j.cels.2018.05.012
Congratulations on successfully completing this tutorial!@misc{proteomics-DIA_Analysis_OSW, author = "Matthias Fahrner and Melanie Föll", title = "DIA Analysis using OpenSwathWorkflow (Galaxy Training Materials)", year = "", month = "", day = "", url = "\url{https://training.galaxyproject.org/training-material/topics/proteomics/tutorials/DIA_Analysis_OSW/tutorial.html}", note = "[Online; accessed TODAY]" } @article{Hiltemann_2023, doi = {10.1371/journal.pcbi.1010752}, url = {https://doi.org/10.1371%2Fjournal.pcbi.1010752}, year = 2023, month = {jan}, publisher = {Public Library of Science ({PLoS})}, volume = {19}, number = {1}, pages = {e1010752}, author = {Saskia Hiltemann and Helena Rasche and Simon Gladman and Hans-Rudolf Hotz and Delphine Larivi{\`{e}}re and Daniel Blankenberg and Pratik D. Jagtap and Thomas Wollmann and Anthony Bretaudeau and Nadia Gou{\'{e}} and Timothy J. Griffin and Coline Royaux and Yvan Le Bras and Subina Mehta and Anna Syme and Frederik Coppens and Bert Droesbeke and Nicola Soranzo and Wendi Bacon and Fotis Psomopoulos and Crist{\'{o}}bal Gallardo-Alba and John Davis and Melanie Christine Föll and Matthias Fahrner and Maria A. Doyle and Beatriz Serrano-Solano and Anne Claire Fouilloux and Peter van Heusden and Wolfgang Maier and Dave Clements and Florian Heyl and Björn Grüning and B{\'{e}}r{\'{e}}nice Batut and}, editor = {Francis Ouellette}, title = {Galaxy Training: A powerful framework for teaching!}, journal = {PLoS Comput Biol} }
You can use Ephemeris's
shed-tools installcommand to install the tools used in this tutorial.shed-tools install [-g GALAXY] [-a API_KEY] -t <(curl https://training.galaxyproject.org/training-material/api/topics/proteomics/tutorials/DIA_Analysis_OSW/tutorial.json | jq .admin_install_yaml -r)Alternatively you can copy and paste the following YAML
---
install_tool_dependencies: true
install_repository_dependencies: true
install_resolver_dependencies: true
tools:
- name: msconvert
  owner: galaxyp
  revisions: 3cf310697624
  tool_panel_section_label: Convert Formats
  tool_shed_url: https://toolshed.g2.bx.psu.edu/
- name: msconvert
  owner: galaxyp
  revisions: 28ffaaa5739f
  tool_panel_section_label: Convert Formats
  tool_shed_url: https://toolshed.g2.bx.psu.edu/
- name: openms_openswathworkflow
  owner: galaxyp
  revisions: 887be35bc42e
  tool_panel_section_label: Proteomics
  tool_shed_url: https://toolshed.g2.bx.psu.edu/
- name: openms_openswathworkflow
  owner: galaxyp
  revisions: ec4490c65f95
  tool_panel_section_label: Proteomics
  tool_shed_url: https://toolshed.g2.bx.psu.edu/
- name: pyprophet_export
  owner: galaxyp
  revisions: 3cf580bf28e2
  tool_panel_section_label: Proteomics
  tool_shed_url: https://toolshed.g2.bx.psu.edu/
- name: pyprophet_merge
  owner: galaxyp
  revisions: a67b508b1dc5
  tool_panel_section_label: Proteomics
  tool_shed_url: https://toolshed.g2.bx.psu.edu/
- name: pyprophet_peptide
  owner: galaxyp
  revisions: 4504b3bc1eed
  tool_panel_section_label: Proteomics
  tool_shed_url: https://toolshed.g2.bx.psu.edu/
- name: pyprophet_protein
  owner: galaxyp
  revisions: 2320f48209fc
  tool_panel_section_label: Proteomics
  tool_shed_url: https://toolshed.g2.bx.psu.edu/
- name: pyprophet_score
  owner: galaxyp
  revisions: 77f068ba47dd
  tool_panel_section_label: Proteomics
  tool_shed_url: https://toolshed.g2.bx.psu.edu/