JavaScript plugins
| Author(s) |
|
| Reviewers |
|
OverviewQuestions:
Objectives:
How can I make a custom visualization plugin for Galaxy?
Learn how to add JavaScript plugins to Galaxy using the Charts visualization framework
Time estimation: 1 hourSupporting Materials:Published: Jun 22, 2017Last modification: Apr 8, 2025License: Tutorial Content is licensed under Creative Commons Attribution 4.0 International License. The GTN Framework is licensed under MITpurl PURL: https://gxy.io/GTN:T00120version Revision: 20
In this tutorial we are going to demonstrate how to add a third party
JavaScript-based visualization to Galaxy, and we’ll talk about what the benefits
are. The plugin we’ve selected for this exercise is the PV-Javascript Protein
Viewer. It is an open source protein structure
viewer for PDB-files. There are many other popular protein structure viewers
available for the visualization of PDB-files such as e.g.
NGL (also available in Galaxy) and
JSMol.
The
PDB-file format contains atomic coordinates of biomolecules derived through a range of experimental and computational methods. Most commonly the file contains a spatial crystallographic snapshot of a protein. There are 100s of thousands of protein structures publicly available at the Protein Data Bank (https://www.rcsb.org). Proteins are usually labeled by a four-letter code. Here is an example of aPDB-file for a hydrolase bond to its inhibitor (PDB: 1ACB):HEADER HYDROLASE/HYDROLASE INHIBITOR 08-NOV-91 1ACB TITLE CRYSTAL AND MOLECULAR STRUCTURE OF THE BOVINE ALPHA-CHYMOTRYPSIN-EGLIN TITLE 2 C COMPLEX AT 2.0 ANGSTROMS RESOLUTION ... KEYWDS SERINE PROTEASE, HYDROLASE-HYDROLASE INHIBITOR COMPLEX AUTHOR R.Z.KRAMER,L.VITAGLIANO,J.BELLA,R.BERISIO,L.MAZZARELLA, AUTHOR 2 B.BRODSKY,A.ZAGARI,H.M.BERMAN ... REMARK 1 REFERENCE 1 REMARK 1 AUTH M.BOLOGNESI,L.PUGLIESE,G.GATTI,F.FRIGERIO,A.CODA,L.ANTOLINI, REMARK 1 AUTH 2 H.P.SCHNEBLI,E.MENEGATTI,G.AMICONI,P.ASCENZI REMARK 1 TITL X-RAY CRYSTAL STRUCTURE OF THE BOVINE REMARK 1 TITL 2 ALPHA-CHYMOTRYPSIN(SLASH)EGLIN C COMPLEX AT 2.6 ANGSTROMS ... SEQRES 1 E 245 CYS GLY VAL PRO ALA ILE GLN PRO VAL LEU SER GLY LEU SEQRES 2 E 245 SER ARG ILE VAL ASN GLY GLU GLU ALA VAL PRO GLY SER SEQRES 3 E 245 TRP PRO TRP GLN VAL SER LEU GLN ASP LYS THR GLY PHE ... ATOM 1 N CYS E 1 2.323 -16.405 18.812 1.00 43.48 N ATOM 2 CA CYS E 1 3.017 -15.136 18.786 1.00 35.11 C ATOM 3 C CYS E 1 4.134 -15.068 19.799 1.00 32.90 C ATOM 4 O CYS E 1 4.173 -15.810 20.772 1.00 41.38 O ATOM 5 CB CYS E 1 2.052 -13.969 19.139 1.00 31.14 C ATOM 6 SG CYS E 1 1.246 -14.085 20.788 1.00 34.72 S ATOM 7 N GLY E 2 4.993 -14.081 19.607 1.00 21.94 N ... HETATM 2292 O HOH E 406 12.343 1.842 12.901 0.86 18.70 O HETATM 2293 O HOH E 407 -4.767 17.237 10.630 1.00 59.78 O HETATM 2294 O HOH E 408 11.489 -6.278 18.740 0.96 20.00 O ...More resources on this file format:
As mentioned above we will be focusing on the PV-Javascript Protein Viewer in this tutorial. Now that we have learned about the underlying file format, let us continue by visiting the protein viewer developer site at https://biasmv.github.io/pv/ to get familiar with the plugin.
Hands On
View the plugin in action, rotate the molecule and change its style.
Under which license is this plugin distributed?
Can you find the minified code file of this plugin?
AgendaIn this tutorial, we will deal with:
Section 1 - Basic plugin setup
Directory and plugin preparations
In this section we will download the viewer and add it to a local Galaxy instance. All development takes place within the Galaxy codebase. The first thing we are going to do is to clone a Galaxy instance and prepare the directory structure for the new visualization plugin.
Hands On
- Clone an instance of Galaxy in a path, further referred to as
$GALAXY_ROOT:$ git clone https://github.com/galaxyproject/galaxy- Navigate to the visualization plugin directory:
$ cd $GALAXY_ROOT/config/plugins/visualizations- Copy the existing example into a new directory:
$ cp -r example myviz
This example visualization provides a great place to start with most of the basics already in place. Now that the directory structure is in place, let us review the example visualization. Each visualization contains a set of 3 files:
- Logo (
static/logo.png) which will appear in Chart’s plugin selection interface. - Configuration (
config/example.xml) describing input parameters and options. - Wrapper (
src/script.js) which serves as a bridge between Galaxy and our 3rd-party plugin.
In the following sections we are going to discuss these files in more detail and modify them to incorporate a new visualization. Let’s start with the logo for our visualization.
Your visualization needs a logo
Each visualization is represented by a logo in the Galaxy interface. This makes
it easier for users to find and configure their visualization. The logo should
be in the png-file format. It will appear with a width of 120 pixels.
Here’s an example logo:
![]()
Hands On
Find an arbitrary image in
PNG-file format. Possibly using Google’s image search.Copy it to the
myviz/staticdirectory and name itlogo.png.
Configure the visualization
Each visualization has a configuration file. In this case it is named
example.xml. This file has conceptual similarities with a Tool’s XML-file. It
allows developers to specify a variety of attributes and input parameters for
their visualization. Throughout this tutorial we are going to gradually augment
this file but for now we keep it simple.
Hands On
Rename the file to
config/myviz.xmlEdit the file named
config/myviz.xmland change the name and description.- Go to the Galaxy root directory to install dependencies, activate the virtual environment, and invoke the Galaxy client build.
$ cd $GALAXY_ROOT $ make setup-venv $ source .venv/bin/activate $ make client- Run Galaxy
$ ./run.sh
Your visualization should now be loaded. You can verify that now by clicking
on Visualize > Create Visualization in the top menu bar of Galaxy and finding
your plugin with its new logo in the list there.
Assign a new datatype to your visualization
Hands On
Open the file named
config/myviz.xmland find the<data_source>section.Replace the existing two
<test>sections with:
<test type="isinstance" test_attr="datatype" result_type="datatype">molecules.PDB</test>Remove the
<settings>and<groups>sections.
This links the plugins to the PDB-file format, which means that for any
history item of this file type the plugin will automatically be available.
Modifying the wrapper
Now let’s take a look at the wrapper which connects our visualization with
Galaxy. The wrapper consists of a module written in JavaScript and is
available at src/script.js:
The wrapper receives an options dictionary with the following four components:
- charts: The model of the current visualization with attributes, settings etc.
- process: A jQuery.Deferred() object to allow asynchronous data requests within the wrapper
- dataset: Details on the selected datasets such as url, ids etc. which can be used to access the dataset
- targets: The DOM ids of the container elements to draw into
In this tutorial we will implement the PV-Viewer plugin. In order to execute a 3rd-party plugin we need to figure out how it works. This can be done by finding a working example or documentation. Fortunately the PV-Viewer comes with both. Let’s take a look at the documentation.
Hands On: Exploring the PV-Viewer
Identify the parameter which is needed to initialize the plugin when calling pv.Viewer().
Which of the wrapper option components represents this parameter?
Can you identify which
modesettings are valid to render the structure with pv.Viewer.renderAs()?
Now that we have learned the basics on how the viewer plugin works, we can edit it and adjust script.js.
Hands On
- Access your visualization’s
myviz/srcdirectory.$ cd $GALAXY_ROOT/config/plugins/visualizations/myviz- Install the package for the PV-Viewer:
yarn add bio-pv- Modify your plugin’s entrypoint script
src/script.jsto import the newbio-pvlibrary we just added, add this at the top of the file:import * as pv from 'bio-pv';- Lastly, replace the
loadfunction contents in the same entrypoint file with the following code that will set up the protein viewer:var viewer = pv.Viewer( document.getElementById( options.targets[ 0 ] ), { width : 'auto', height : 'auto', antialias : true, outline : true }); $.ajax( { url : options.dataset.download_url, success : function( response ) { var structure = pv.io.pdb( response ); viewer.clear(); viewer.renderAs( 'protein', structure, 'cartoon', {} ); viewer.centerOn( structure ); viewer.autoZoom(); options.chart.state('ok', 'Chart drawn.'); options.process.resolve(); } });
Build the package
Now that we have completed the basic plugin definition, it is time to build the
scripts and libraries into a single bundle that Galaxy can use. Galaxy
visualizations typically use Parcel for this due to
its simplicity, and this is how the example project is already configured. If
you’re interested in more details, take a look at the package.json file in
your myviz plugin directory.
After it has been built and staged the plugin will be accessible through Galaxy’s user interface. This process not require restarting your Galaxy instance, just make sure to properly refresh your browser.
Hands On
- Navigate to your visualization’s root directory:
$ cd $GALAXY_ROOT/config/plugins/visualizations/myviz- Install any necessary JavaScript dependencies:
$ yarn install- Run the plugin build process using yarn:
$ yarn run build- Stage the scripts and run Galaxy:
$ cd $GALAXY_ROOT
$ make client
$ ./run.sh
Lets test this.
Comment: Clearing the Cache“For Developers” or anyone who needs to build multiple times, you may need to clear the cached files in multiple places using any of the following tasks:
Within the
clientdirectory so that the staged files are appropriately cleared out, to build more than once use:yarn run gulp pluginsIf rebuild continues to fail: (1) delete the hidden cache directories in the
plugins/your-plugin/directory, (2) delete theplugin_build_hash.txtfile in order to force a rebuild, and (3) delete the transpiledstatic/script.jsfile in theyour-plugin/directory.
Test the visualization
In this section we will select a PDB-file from the Protein Data Bank and visualize it with our new plugin.
Hands On
Visit https://www.rcsb.org and select a protein structure e.g. 1ACB
Copy the link to the raw
PDB-file e.g.https://files.rcsb.org/view/1ACB.pdbStart your Galaxy instance
$ cd $GALAXY_ROOT
$ ./run.sh
Open the upload dialog, paste the above link and click on Start.
Close the upload dialog, and select the file from the history panel on the right.
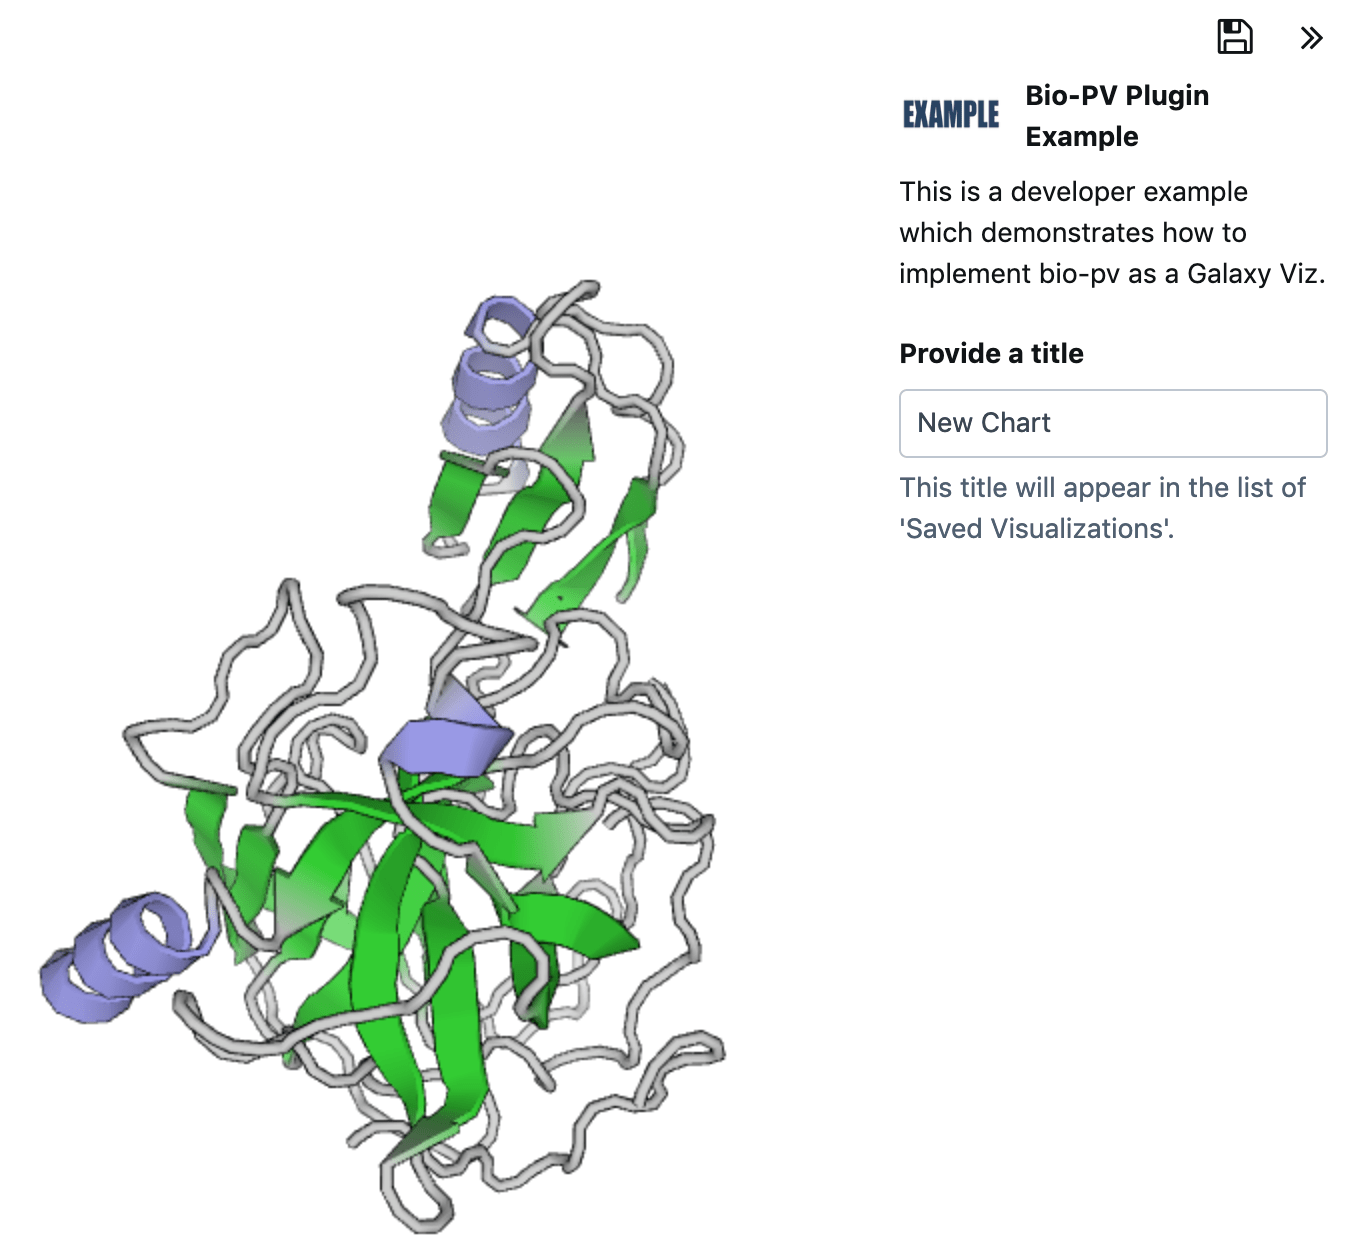
Click on the diagram icon. (You must be logged in)
Find your visualization and click on its logo.
Section 2 - Allow different rendering modes
In this section we are going to augment the visualization such that users may select different rendering modes. Similar to a Tool’s XML file, developers may specify input parameters which then will be presented to the user. The definition of Tool and Visualization input parameters are similar, however the latter is provided in JavaScript and not as XML.
More information on parameters can be found in the wiki.
Hands On
- Add the following block into the
myviz.xmlfile:<settings> <input> <name>mode</name> <label>Display mode</label> <type>select</type> <display>radio</display> <value>cartoon</value> <help>Select the rendering mode.</help> <data> <data> <value>cartoon</value> <label>Cartoon</label> </data> <data> <value>lines</value> <label>Lines</label> </data> <data> <value>points</value> <label>Points</label> </data> </data> </input> </settings>- Change the following line in
script.js:viewer.renderAs( 'protein', structure, 'cartoon', {} );to
var settings = options.chart.settings;
viewer.renderAs( 'protein', structure, settings.get( 'mode' ), {} );
Rebuild the plugin
$ yarn run build
$ cd $GALAXY_ROOT
$ make client
Refresh your browser.
- Load your visualization and test different rendering modes in the Customization tab of your visualization.
Conclusion
First of all, thank you for completing this tutorial. We have learned how to add JavaScript visualizations to Galaxy utilizing the Charts framework.
You've Finished the Tutorial
Key points
Demonstrating a pluggable extension system for JavaScript visualizations
With three primary files we can integrate any JavaScript visualization into Galaxy
Frequently Asked Questions
Have questions about this tutorial? Have a look at the available FAQ pages and support channelsFeedback
Did you use this material as an instructor? Feel free to give us feedback on how it went.
Did you use this material as a learner or student? Click the form below to leave feedback.

Citing this Tutorial
- Saskia Hiltemann, Youri Hoogstrate, Björn Grüning, Aysam Guerler, Dannon Baker, JavaScript plugins (Galaxy Training Materials). https://training.galaxyproject.org/training-material/topics/dev/tutorials/visualization-charts/tutorial.html Online; accessed TODAY
- Hiltemann, Saskia, Rasche, Helena et al., 2023 Galaxy Training: A Powerful Framework for Teaching! PLOS Computational Biology 10.1371/journal.pcbi.1010752
- Batut et al., 2018 Community-Driven Data Analysis Training for Biology Cell Systems 10.1016/j.cels.2018.05.012
@misc{dev-visualization-charts,
author = "Saskia Hiltemann and Youri Hoogstrate and Björn Grüning and Aysam Guerler and Dannon Baker",
	title = "JavaScript plugins (Galaxy Training Materials)",
	year = "",
	month = "",
	day = "",
	url = "\url{https://training.galaxyproject.org/training-material/topics/dev/tutorials/visualization-charts/tutorial.html}",
	note = "[Online; accessed TODAY]"
}
@article{Hiltemann_2023,
	doi = {10.1371/journal.pcbi.1010752},
	url = {https://doi.org/10.1371%2Fjournal.pcbi.1010752},
	year = 2023,
	month = {jan},
	publisher = {Public Library of Science ({PLoS})},
	volume = {19},
	number = {1},
	pages = {e1010752},
	author = {Saskia Hiltemann and Helena Rasche and Simon Gladman and Hans-Rudolf Hotz and Delphine Larivi{\`{e}}re and Daniel Blankenberg and Pratik D. Jagtap and Thomas Wollmann and Anthony Bretaudeau and Nadia Gou{\'{e}} and Timothy J. Griffin and Coline Royaux and Yvan Le Bras and Subina Mehta and Anna Syme and Frederik Coppens and Bert Droesbeke and Nicola Soranzo and Wendi Bacon and Fotis Psomopoulos and Crist{\'{o}}bal Gallardo-Alba and John Davis and Melanie Christine Föll and Matthias Fahrner and Maria A. Doyle and Beatriz Serrano-Solano and Anne Claire Fouilloux and Peter van Heusden and Wolfgang Maier and Dave Clements and Florian Heyl and Björn Grüning and B{\'{e}}r{\'{e}}nice Batut and},
	editor = {Francis Ouellette},
	title = {Galaxy Training: A powerful framework for teaching!},
	journal = {PLoS Comput Biol}
}
Funding
These individuals or organisations provided funding support for the development of this resource
Congratulations on successfully completing this tutorial!
