De novo transcriptome assembly, annotation, and differential expression analysis
Under Development!
This tutorial is not in its final state. The content may change a lot in the next months. Because of this status, it is also not listed in the topic pages.
| Author(s) |
|
| Reviewers |
|
OverviewQuestions:
Objectives:
Which biological questions are addressed by the tutorial?
Which bioinformatics techniques are important to know for this type of data?
Requirements:
The learning objectives are the goals of the tutorial
They will be informed by your audience and will communicate to them and to yourself what you should focus on during the course
They are single sentences describing what a learner should be able to do once they have completed the tutorial
You can use Bloom’s Taxonomy to write effective learning objectives
- Introduction to Galaxy Analyses
- slides Slides: Quality Control
- tutorial Hands-on: Quality Control
- slides Slides: Mapping
- tutorial Hands-on: Mapping
Time estimation: 3 hoursSupporting Materials:Published: Feb 13, 2020Last modification: Nov 9, 2023License: Tutorial Content is licensed under Creative Commons Attribution 4.0 International License. The GTN Framework is licensed under MITpurl PURL: https://gxy.io/GTN:T00290rating Rating: 1.0 (1 recent ratings, 12 all time)version Revision: 8
As a result of the development of novel sequencing technologies, the years between 2008 and 2012 saw a large drop in the cost of sequencing. Per megabase and genome, the cost dropped to 1/100,000th and 1/10,000th of the price, respectively. Prior to this, only transcriptomes of organisms that were of broad interest and utility to scientific research were sequenced; however, these developed in 2010s high-throughput sequencing (also called next-generation sequencing) technologies are both cost- and labor- effective, and the range of organisms studied via these methods is expanding.
Examining non-model organisms can provide novel insights into the mechanisms underlying the “diversity of fascinating morphological innovations” that have enabled the abundance of life on planet Earth. In animals and plants, the “innovations” that cannot be examined in common model organisms include mimicry, mutualism, parasitism, and asexual reproduction. De novo transcriptome assembly is often the preferred method to studying non-model organisms, since it is cheaper and easier than building a genome, and reference-based methods are not possible without an existing genome. The transcriptomes of these organisms can thus reveal novel proteins and their isoforms that are implicated in such unique biological phenomena.
AgendaIn this tutorial, we will cover:
- Read cleaning (20 minutes)
- Assembly (120 minutes - computing)
- Assembly assessment / cleaning
- Checking of the assembly statistics
- Remapping on the raw transcriptome
- Merge the mapping tables and compute normalizations
- Compute contig Ex90N50 statistic and Ex90 transcript count
- Transcriptome annotation completeness
- Filter low expression transcripts
- Checking of the assembly statistics after cleaning
- Annotation
- Differential Expression (DE) Analysis
- Conclusion
Read cleaning (20 minutes)
Known sequencing biases:
- Unknown nucleotides (Ns)
- Bad quality nucleotides
- Hexamers biases (Illumina. Now corrected ?)
Why do we need to correct those?
- To remove a lot of sequencing errors (detrimental to the vast majority of assemblers)
- Because most de-bruijn graph based assemblers can’t handle unknown nucleotides
Get data
Hands On: Data upload
Create a new history for this tutorial
To create a new history simply click the new-history icon at the top of the history panel:
- Import the 12
fq.gzinto aList of Pairscollection namedfastq_raw
- Option 1: from a shared data library (ask your instructor)
Option 2: from Zenodo using the URLs given below
https://zenodo.org/record/3541678/files/A1_left.fq.gz
https://zenodo.org/record/3541678/files/A1_right.fq.gz
https://zenodo.org/record/3541678/files/A2_left.fq.gz
https://zenodo.org/record/3541678/files/A2_right.fq.gz
https://zenodo.org/record/3541678/files/A3_left.fq.gz
https://zenodo.org/record/3541678/files/A3_right.fq.gz
https://zenodo.org/record/3541678/files/B1_left.fq.gz
https://zenodo.org/record/3541678/files/B1_right.fq.gz
https://zenodo.org/record/3541678/files/B2_left.fq.gz
https://zenodo.org/record/3541678/files/B2_right.fq.gz
https://zenodo.org/record/3541678/files/B3_left.fq.gz
https://zenodo.org/record/3541678/files/B3_right.fq.gz
- Copy the link location
Click galaxy-upload Upload at the top of the activity panel
Click on Collection on the top
Click on Collection Type and select
List of Pairs- Select galaxy-wf-edit Paste/Fetch Data
Paste the link(s) into the text field
Press Start
Click on Build when available
Enter a name for the collection
- fastq_raw
- Click on Create list (and wait a bit)
As an alternative to uploading the data from a URL or your computer, the files may also have been made available from a shared data library:
- Go into Libraries (left panel)
- Navigate to the correct folder as indicated by your instructor.
- On most Galaxies tutorial data will be provided in a folder named GTN - Material –> Topic Name -> Tutorial Name.
- Select the desired files
- Click on Add to History galaxy-dropdown near the top and select as Datasets from the dropdown menu
In the pop-up window, choose
- “Select history”: the history you want to import the data to (or create a new one)
- Click on Import
- Rename the datasets
Check that the datatype
- Click on the galaxy-pencil pencil icon for the dataset to edit its attributes
- In the central panel, click galaxy-chart-select-data Datatypes tab on the top
- In the galaxy-chart-select-data Assign Datatype, select
datatypesfrom “New Type” dropdown
- Tip: you can start typing the datatype into the field to filter the dropdown menu
- Click the Save button
Add to each database a tag corresponding to …
Datasets can be tagged. This simplifies the tracking of datasets across the Galaxy interface. Tags can contain any combination of letters or numbers but cannot contain spaces.
To tag a dataset:
- Click on the dataset to expand it
- Click on Add Tags galaxy-tags
- Add tag text. Tags starting with
#will be automatically propagated to the outputs of tools using this dataset (see below).- Press Enter
- Check that the tag appears below the dataset name
Tags beginning with
#are special!They are called Name tags. The unique feature of these tags is that they propagate: if a dataset is labelled with a name tag, all derivatives (children) of this dataset will automatically inherit this tag (see below). The figure below explains why this is so useful. Consider the following analysis (numbers in parenthesis correspond to dataset numbers in the figure below):
- a set of forward and reverse reads (datasets 1 and 2) is mapped against a reference using Bowtie2 generating dataset 3;
- dataset 3 is used to calculate read coverage using BedTools Genome Coverage separately for
+and-strands. This generates two datasets (4 and 5 for plus and minus, respectively);- datasets 4 and 5 are used as inputs to Macs2 broadCall datasets generating datasets 6 and 8;
- datasets 6 and 8 are intersected with coordinates of genes (dataset 9) using BedTools Intersect generating datasets 10 and 11.
Now consider that this analysis is done without name tags. This is shown on the left side of the figure. It is hard to trace which datasets contain “plus” data versus “minus” data. For example, does dataset 10 contain “plus” data or “minus” data? Probably “minus” but are you sure? In the case of a small history like the one shown here, it is possible to trace this manually but as the size of a history grows it will become very challenging.
The right side of the figure shows exactly the same analysis, but using name tags. When the analysis was conducted datasets 4 and 5 were tagged with
#plusand#minus, respectively. When they were used as inputs to Macs2 resulting datasets 6 and 8 automatically inherited them and so on… As a result it is straightforward to trace both branches (plus and minus) of this analysis.More information is in a dedicated #nametag tutorial.


Quality control
Hands On: Task description
- FastQC tool with the following parameters:
- “Short read data from your current history”:
fastq_raw(collection)
Read cleaning with Trimmomatic
Hands On: Task description
- Trimmomatic tool with the following parameters:
- “Single-end or paired-end reads?”:
Paired-end (as collection)- “Select FASTQ dataset collection with R1/R2 pair”:
fastq_raw- “Perform initial ILLUMINACLIP step?”:
Yes- “Adapter sequences to use”:
TruSeq3 (additional seqs) (paired-ended, for MiSeq and HiSeq)- In “Trimmomatic Operation”:
- param-repeat “Insert Trimmomatic Operation”
- “Select Trimmomatic operation to perform”:
Cut bases off end of a read, if below a threshold quality (TRAILING)- param-repeat “Insert Trimmomatic Operation”
- “Select Trimmomatic operation to perform”:
Cut bases off start of a read, if below a threshold quality (LEADING)- param-repeat “Insert Trimmomatic Operation”
- “Select Trimmomatic operation to perform”:
Sliding window trimming (SLIDINGWINDOW)- param-repeat “Insert Trimmomatic Operation”
- “Select Trimmomatic operation to perform”:
Drop reads with average quality lower than a specific level (AVGQUAL)
- “Minimum length of reads to be kept”:
25- param-repeat “Insert Trimmomatic Operation”
- “Select Trimmomatic operation to perform”:
Drop reads below a specified length (MINLEN)
- “Minimum length of reads to be kept”:
50- “Output trimmomatic log messages?”:
Yes- Rename the Dataset Collection
Trimmomatic on collection XX: paired->fastqc_cleanedCommentYou can check the Trimmomatic log files to get the number of read before and after the cleaning
Input Read Pairs: 10000
Both Surviving: 8804 (88.04%)
Forward Only Surviving: 491 (4.91%)
Reverse Only Surviving: 456 (4.56%) Dropped: 249 (2.49%)
- Click on the collection
- Click on the name of the collection at the top
- Change the name
- Press Enter
Quality control after cleaning
Hands On: Task description
- FastQC tool with the following parameters:
- “Short read data from your current history”:
fastqc_cleaned(collection)
Assembly (120 minutes - computing)
Assembly with Trinity
Hands On: Task description
- Trinity tool with the following parameters:
- “Are you pooling sequence datasets?”:
Yes
- “Paired or Single-end data?”:
Paired-end collection
- “Strand specific data”:
No- “Run in silico normalization of reads”:
No- In “Additional Options”:
- “Use the genome guided mode?”:
No- Rename the Trinity output
Trinity on data 52, data 51, and others: Assembled Transcripts->transcriptome_raw.fasta
- Click on the galaxy-pencil pencil icon for the dataset to edit its attributes
- In the central panel, change the Name field
- Click the Save button
Assembly assessment / cleaning
Checking of the assembly statistics
Hands On: Task description
- Trinity Statistics tool with the following parameters:
- “Trinity assembly”:
transcriptome_raw.fastaCommentThis step, even with this toy dataset, will take around 2 hours
Remapping on the raw transcriptome
Hands On: Task description
- Align reads and estimate abundance tool with the following parameters:
- “Transcripts”:
transcriptome_raw.fasta- “Paired or Single-end data?”:
Paired
- “Left/Forward strand reads” ->
Multiple datasets
- Click on the Folder button at the right
- Type to Search:
left- Select the 6
Trimmomatic on ..._left.fq.gz- “Right/Reverse strand reads” ->
Multiple datasets
- Click on the Folder button at the right
- Type to Search:
right- Select the 6
Trimmomatic on ..._left.fq.gz- “Strand specific data”:
Yes- “Abundance estimation method”:
Salmon- In “Additional Options”:
- “Trinity assembly?”:
Yes- Rename the 6
* isoforms counts:(
- Check in the information panel (i icon) the lineage of your file (ex:
A1_left.fq.gz… )- Rename the datasets:
A1_raw,A2_raw,A3_raw,B1_raw,B2_raw,B3_raw.CommentIf you check at the Standard Error messages of your outputs. You can get the
Mapping rate
- Click on one dataset
- Click on the little i icon
- Click on Tool Standard Error: stderr
[2019-11-14 15:44:21.500] [jointLog] [info] Mapping rate = 44.4358%CommentAt this stage, you can now delete some useless datasets
Trimmomatic on collection XX: unpairedAlign reads and estimate abundance on *: genes countsNote that the dataset are just hidden. You can delete them permanently and make some room in the history options (the little wheel icon)
Merge the mapping tables and compute normalizations
Hands On: Task description
- Build expression matrix tool with the following parameters:
- “Abundance estimates”:
A1_raw,A2_raw,A3_raw,B1_raw,B2_raw,B3_raw- “Abundance estimation method”:
Salmon
QuestionWhat are the three tables?
estimated RNA-Seq fragment isoform counts (raw counts)`matrix of isoform TPM expression values (not cross-sample normalized)matrix of TMM-normalized expression values
Compute contig Ex90N50 statistic and Ex90 transcript count
Hands On: Task description
- Compute contig Ex90N50 statistic and Ex90 transcript count tool with the following parameters:
- “Expression matrix”:
Build expression matrix: matrix of TMM-normalized expression values- “Transcripts”:
transcriptome_raw.fasta- Click on the visulization icon on the dataset
Compute contig Ex90N50 statistic and Ex90 transcript count: ExN50 statistics
- Scatterplot - Creates a 2D-scatterplot from tabular datapoints
- “X Column”: select the Columns
1- “Y Column”: select the Columns
2
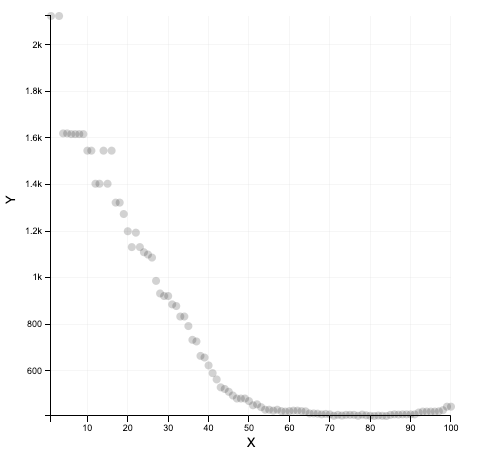
What we get
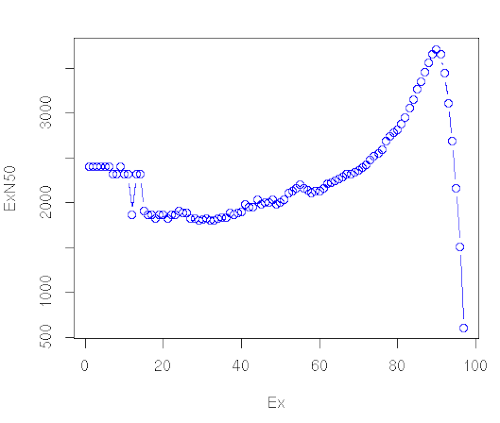
What we should get with a real dataset
Transcriptome annotation completeness
Hands On: Task description
- Busco tool with the following parameters:
- “Sequence to analyse”:
transcriptome_raw.fasta- “Mode”:
transcriptome- “Lineage”:
eukaryota_odb9
Filter low expression transcripts
Hands On: Task description
- Filter low expression transcripts tool with the following parameters:
- “Trinity assembly”:
transcriptome_raw.fasta- “Expression matrix”:
Build expression matrix: matrix of isoform TPM expression values (not cross-sample normalized)- “Minimum expression level required across any sample”:
1.0- “Isoform filtering method”:
Keep all isoforms above a minimum percent of dominant expression
- “Minimum percent of dominant isoform expression”:
1CommentIf you check at the Standard Error messages of your outputs. You can get the
Retainedrate
- Click on one dataset
- Click on the little i icon
- Click on Tool Standard Error: stderr
Retained 2096 / 2102 = 99.71% of total transcripts.- Rename the output
Filter low expression transcripts on data 42 and data 14: filtered low expression transcripts->transcriptome_filtered.fasta
Checking of the assembly statistics after cleaning
Hands On: Task description
- Trinity Statistics tool with the following parameters:
- “Trinity assembly”:
transcriptome_filtered.fasta
Annotation
Generate gene to transcript map
Hands On: Task description
- Generate gene to transcript map tool with the following parameters:
- “Trinity assembly”:
transcriptome_filtered.fasta
Peptide prediction
Hands On: Task description
- TransDecoder tool with the following parameters:
- “Transcripts”:
transcriptome_filtered.fasta- In “Training Options”:
- “Select the training method”:
Train with the top longest ORFs
Similarity search
Hands On: Task description
- Diamond tool with the following parameters:
- “What do you want to align?”:
Align amino acid query sequences (blastp)- “Input query file in FASTA or FASTQ format”:
TransDecoder on data XXX: pep- “Select a reference database”:
Uniprot Swissprot- “Format of output file”:
BLAST Tabular- In “Method to restrict the number of hits?”:
Maximum number of target sequences
- “The maximum number of target sequence per query to report alignments for”:
1- Rename the Diamond output
Diamond on data XXX->Diamond (blastp)- Diamond tool with the following parameters:
- “What do you want to align?”:
Align DNA query sequences (blastx)- “Input query file in FASTA or FASTQ format”:
transcriptome_filtered.fasta- “Select a reference database”:
Uniprot Swissprot- “Format of output file”:
BLAST Tabular- In “Method to restrict the number of hits?”:
Maximum number of target sequences
- “The maximum number of target sequence per query to report alignments for”:
1- Rename the Diamond output
Diamond on data XXX->Diamond (blastx)CommentNote that you can both use Diamond tool or the NCBI BLAST+ blastp tool and NCBI BLAST+ blast tool
Find signal peptides
Hands On: Task description
- SignalP 3.0 tool with the following parameters:
- “Fasta file of protein sequences”:
TransDecoder on data XXX: pep
Find transmembrane domains
Hands On: Task description
- TMHMM 2.0 tool with the following parameters:
- “FASTA file of protein sequences”:
TransDecoder on data XXX: pep
Search again profile database
Hands On: Task description
- hmmscan tool with the following parameters:
- “Sequence file”:
TransDecoder on data XXX: pep
Transcriptome annotation using Trinotate
Hands On: Task description
- Trinotate tool with the following parameters:
- “Transcripts”:
transcriptome_filtered.fasta- “Peptides”:
TransDecoder on data XXX: pep- “Genes to transcripts map”:
Generate gene to transcript map on data XXX: Genes to transcripts map- “BLASTP: Peptides vs Uniprot.SwissProt”:
Diamond (blastp)- “BLASTX: Transcripts vs Uniprot.SwissProt”:
Diamond (blastx)- “HMMER hmmscan: Peptides vs PFAM”:
Table of per-domain hits from HMM matches of TransDecoder on data XXX: pep against the profile database- “TMHMM on Peptides”:
TMHMM results- “SignalP on Peptides”:
SignalP euk results- “Let Galaxy downloading the Trinotate Pre-generated Resource SQLite database”:
Yes
Differential Expression (DE) Analysis
Remapping on the filtered transcriptome using
Hands On: Task description
- Align reads and estimate abundance tool with the following parameters:
- “Transcripts”:
transcriptome_filtered.fasta- “Paired or Single-end data?”:
Paired
- “Left/Forward strand reads” ->
Multiple datasets
- Click on the Folder button at the right
- Type to Search:
left- Select the 6
Trimmomatic on ..._left.fq.gz- “Right/Reverse strand reads” ->
Multiple datasets
- Click on the Folder button at the right
- Type to Search:
right- Select the 6
Trimmomatic on ..._left.fq.gz- “Strand specific data”:
Yes- “Abundance estimation method”:
Salmon- In “Additional Options”:
- “Trinity assembly?”:
Yes- Rename the 6
* isoforms counts:(
- Check in the information panel (i icon) the lineage of your file (ex:
A1_left.fq.gz… )- Rename the datasets:
A1,A2,A3,B1,B2,B3.CommentIf you check at the Standard Error messages of your outputs. You can get the
Mapping rate
- Click on one dataset
- Click on the little i icon
- Click on Tool Standard Error: stderr
[2019-11-14 15:44:21.500] [jointLog] [info] Mapping rate = 44.4358%CommentAt this stage, you can now delete some useless datasets
Align reads and estimate abundance on *: genes countsNote that the dataset are just hidden. You can delete them permanently and make some room in the history options (the little wheel icon)
Merge the mapping tables and compute a TMM normalization
Hands On: Task description
- Build expression matrix tool with the following parameters:
- “Abundance estimates”:
A1,A2,A3,B1,B2,B3- “Abundance estimation method”:
Salmon- Describe samples and replicates tool with the following parameters:
- “Samples”
- “1: Samples”:
- “Full sample name”:
A1- “Condition”:
A- “2: Samples”:
- “Full sample name”:
A2- “Condition”:
A- …:
- “6: Samples”:
- “Full sample name”:
B3- “Condition”:
B
RNASeq samples quality check
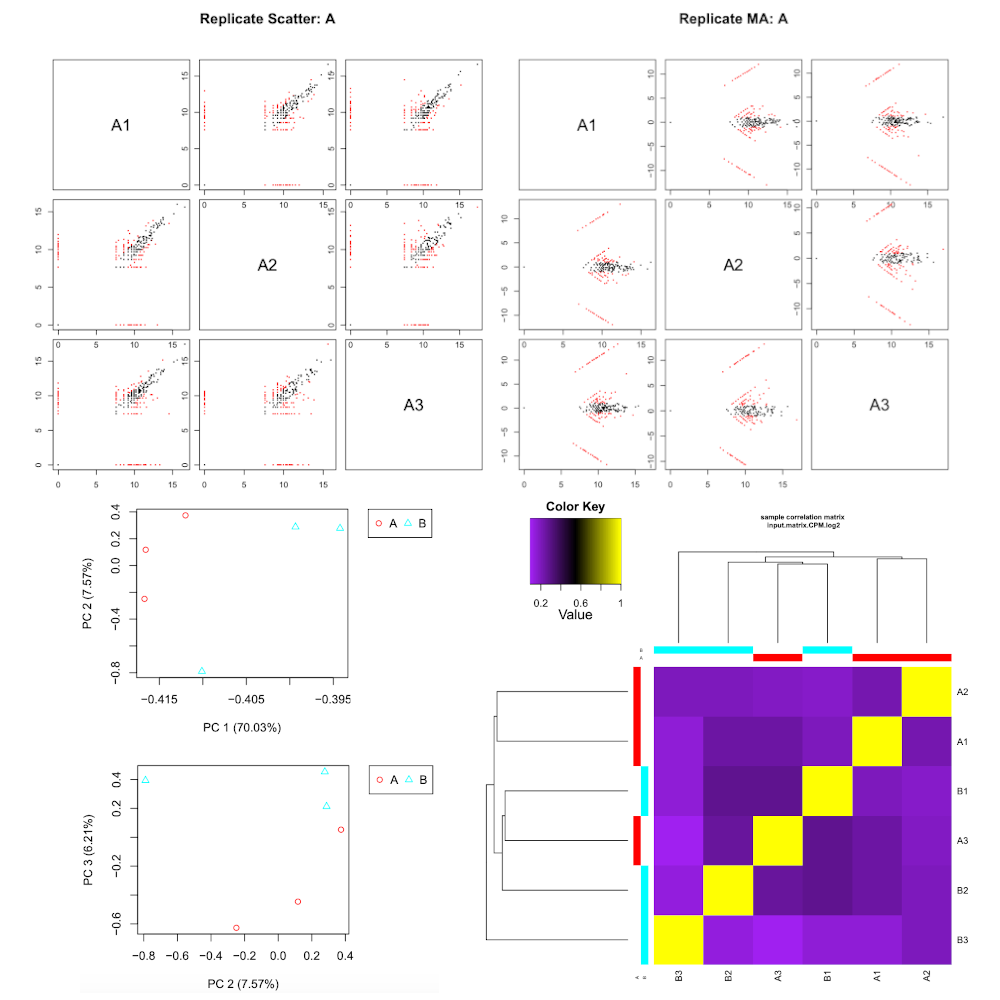
Hands On: Task description
- RNASeq samples quality check tool with the following parameters:
- “Expression matrix”:
Build expression matrix: estimated RNA-Seq fragment isoform counts (raw counts)- “Samples description”:
Describe samples
Differential expression analysis
Hands On: Task description
- Differential expression analysis tool with the following parameters:
- “Expression matrix”:
Build expression matrix: estimated RNA-Seq fragment isoform counts (raw counts)- “Sample description”:
Describe samples(the last one)- “Differential analysis method”:
DESeq2
Extract and cluster differentially expressed transcripts
Hands On: Task description
- Extract and cluster differentially expressed transcripts tool with the following parameters:
- In “Additional Options”:
- “Expression matrix”:
Build expression matrix: estimated RNA-Seq fragment isoform counts (raw counts)- “Sample description”:
Describe samples- “Differential expression results”:
Differential expression results on data XXX and data XXX- “p-value cutoff for FDR”:
1- “Run GO enrichment analysis”:
NoComment“p-value cutoff for FDR”:
1Don’t do this at home! It’s because we have a Toy Dataset. The cutoff should be around0.001
Partition genes into expression clusters
Hands On: Task description
- Partition genes into expression clusters tool with the following parameters:
- “RData file”:
Extract and cluster differentially expressed transcripts: RData file- “Method for partitioning genes into clusters”:
Cut tree based on x percent of max(height) of tree
Conclusion
Sum up the tutorial and the key takeaways here. We encourage adding an overview image of the pipeline used.
You've Finished the Tutorial
Key points
The take-home messages
They will appear at the end of the tutorial
Frequently Asked Questions
Have questions about this tutorial? Have a look at the available FAQ pages and support channelsUseful literature
Further information, including links to documentation and original publications, regarding the tools, analysis techniques and the interpretation of results described in this tutorial can be found here.
Feedback
Did you use this material as an instructor? Feel free to give us feedback on how it went.
Did you use this material as a learner or student? Click the form below to leave feedback.

Citing this Tutorial
- Anthony Bretaudeau, Gildas Le Corguillé, Erwan Corre, Xi Liu, De novo transcriptome assembly, annotation, and differential expression analysis (Galaxy Training Materials). https://training.galaxyproject.org/training-material/topics/transcriptomics/tutorials/full-de-novo/tutorial.html Online; accessed TODAY
- Hiltemann, Saskia, Rasche, Helena et al., 2023 Galaxy Training: A Powerful Framework for Teaching! PLOS Computational Biology 10.1371/journal.pcbi.1010752
- Batut et al., 2018 Community-Driven Data Analysis Training for Biology Cell Systems 10.1016/j.cels.2018.05.012
Congratulations on successfully completing this tutorial!@misc{transcriptomics-full-de-novo, author = "Anthony Bretaudeau and Gildas Le Corguillé and Erwan Corre and Xi Liu", title = "De novo transcriptome assembly, annotation, and differential expression analysis (Galaxy Training Materials)", year = "", month = "", day = "", url = "\url{https://training.galaxyproject.org/training-material/topics/transcriptomics/tutorials/full-de-novo/tutorial.html}", note = "[Online; accessed TODAY]" } @article{Hiltemann_2023, doi = {10.1371/journal.pcbi.1010752}, url = {https://doi.org/10.1371%2Fjournal.pcbi.1010752}, year = 2023, month = {jan}, publisher = {Public Library of Science ({PLoS})}, volume = {19}, number = {1}, pages = {e1010752}, author = {Saskia Hiltemann and Helena Rasche and Simon Gladman and Hans-Rudolf Hotz and Delphine Larivi{\`{e}}re and Daniel Blankenberg and Pratik D. Jagtap and Thomas Wollmann and Anthony Bretaudeau and Nadia Gou{\'{e}} and Timothy J. Griffin and Coline Royaux and Yvan Le Bras and Subina Mehta and Anna Syme and Frederik Coppens and Bert Droesbeke and Nicola Soranzo and Wendi Bacon and Fotis Psomopoulos and Crist{\'{o}}bal Gallardo-Alba and John Davis and Melanie Christine Föll and Matthias Fahrner and Maria A. Doyle and Beatriz Serrano-Solano and Anne Claire Fouilloux and Peter van Heusden and Wolfgang Maier and Dave Clements and Florian Heyl and Björn Grüning and B{\'{e}}r{\'{e}}nice Batut and}, editor = {Francis Ouellette}, title = {Galaxy Training: A powerful framework for teaching!}, journal = {PLoS Comput Biol} }
You can use Ephemeris's
shed-tools installcommand to install the tools used in this tutorial.shed-tools install [-g GALAXY] [-a API_KEY] -t <(curl https://training.galaxyproject.org/training-material/api/topics/transcriptomics/tutorials/full-de-novo/tutorial.json | jq .admin_install_yaml -r)Alternatively you can copy and paste the following YAML
---
install_tool_dependencies: true
install_repository_dependencies: true
install_resolver_dependencies: true
tools:
- name: fastqc
  owner: devteam
  revisions: f2e8552cf1d0
  tool_panel_section_label: FASTA/FASTQ
  tool_shed_url: https://toolshed.g2.bx.psu.edu/
- name: describe_samples
  owner: iuc
  revisions: '0693ccd171c4'
  tool_panel_section_label: RNA Analysis
  tool_shed_url: https://toolshed.g2.bx.psu.edu/
- name: multiqc
  owner: iuc
  revisions: e4574a4d09d8
  tool_panel_section_label: Quality Control
  tool_shed_url: https://toolshed.g2.bx.psu.edu/
- name: transdecoder
  owner: iuc
  revisions: 0db979fead3a
  tool_panel_section_label: RNA Analysis
  tool_shed_url: https://toolshed.g2.bx.psu.edu/
- name: trinity
  owner: iuc
  revisions: c9cfec002f71
  tool_panel_section_label: RNA Analysis
  tool_shed_url: https://toolshed.g2.bx.psu.edu/
- name: trinity_abundance_estimates_to_matrix
  owner: iuc
  revisions: d6a479fd4281
  tool_panel_section_label: RNA Analysis
  tool_shed_url: https://toolshed.g2.bx.psu.edu/
- name: trinity_align_and_estimate_abundance
  owner: iuc
  revisions: 478f36effca1
  tool_panel_section_label: RNA Analysis
  tool_shed_url: https://toolshed.g2.bx.psu.edu/
- name: trinity_analyze_diff_expr
  owner: iuc
  revisions: fab23c3b5258
  tool_panel_section_label: RNA Analysis
  tool_shed_url: https://toolshed.g2.bx.psu.edu/
- name: trinity_contig_exn50_statistic
  owner: iuc
  revisions: 34a018cbee9c
  tool_panel_section_label: RNA Analysis
  tool_shed_url: https://toolshed.g2.bx.psu.edu/
- name: trinity_define_clusters_by_cutting_tree
  owner: iuc
  revisions: 33406f5a445c
  tool_panel_section_label: RNA Analysis
  tool_shed_url: https://toolshed.g2.bx.psu.edu/
- name: trinity_filter_low_expr_transcripts
  owner: iuc
  revisions: e406ac71165d
  tool_panel_section_label: RNA Analysis
  tool_shed_url: https://toolshed.g2.bx.psu.edu/
- name: trinity_run_de_analysis
  owner: iuc
  revisions: 1d689e4e1caf
  tool_panel_section_label: RNA Analysis
  tool_shed_url: https://toolshed.g2.bx.psu.edu/
- name: trinity_samples_qccheck
  owner: iuc
  revisions: 9871104ea630
  tool_panel_section_label: RNA Analysis
  tool_shed_url: https://toolshed.g2.bx.psu.edu/
- name: trinotate
  owner: iuc
  revisions: 6fd16fad465d
  tool_panel_section_label: RNA Analysis
  tool_shed_url: https://toolshed.g2.bx.psu.edu/
- name: trimmomatic
  owner: pjbriggs
  revisions: f8a9a5eaca8a
  tool_panel_section_label: FASTA/FASTQ
  tool_shed_url: https://toolshed.g2.bx.psu.edu/