A Short Introduction to Galaxy
Contributors
Questions
What is Galaxy?
Why should I use Galaxy?
How do I use Galaxy?
How can I connect with the Galaxy Community?
What is Galaxy?
Speaker Notes
What is Galaxy?

Data Intensive analysis for everyone
.pull-left[
- Data Analysis platform
- Web-based
- Easy to use
-
Free and Open Source
- Many tools (>10,500 in the Galaxy Tool Shed)
- Popular (>13,000 publications)
- Extensive tutorials available
]
.pull-right[
 ]
]
.footnote[Homepage: galaxyproject.org]
Speaker Notes
- Galaxy is a web-based data analysis platform.
- It is easy to use and completely free.
- Galaxy offers over ten thousand analysis tools.
- Galaxy is widely used. It currently has over thirteen thousand publications.
Why use Galaxy?
- It’s easy!
- No installation, all you need is a browser.
- No complex commands, just point and click!
- Makes your research reproducible
- Galaxy keeps track of all analysis details
- Cross-domain: bioinformatics, chemistry, ecology, climate science, digital humanities …

Speaker Notes
- Data analysis can be very complex.
- It often requires specialized programming knowledge or command-line skills.
- Galaxy makes this a lot easier by providing a web-based user interface to popular data analysis tools.
- This means you don’t have to install anything, just open your browser and go to Galaxy.
- Galaxy also helps you make your research reproducible by keeping track of your analysis steps.
- Galaxy supports many different scientific domains.
How do I use Galaxy?
Speaker Notes
- How do I use Galaxy?
Find a Galaxy server
-
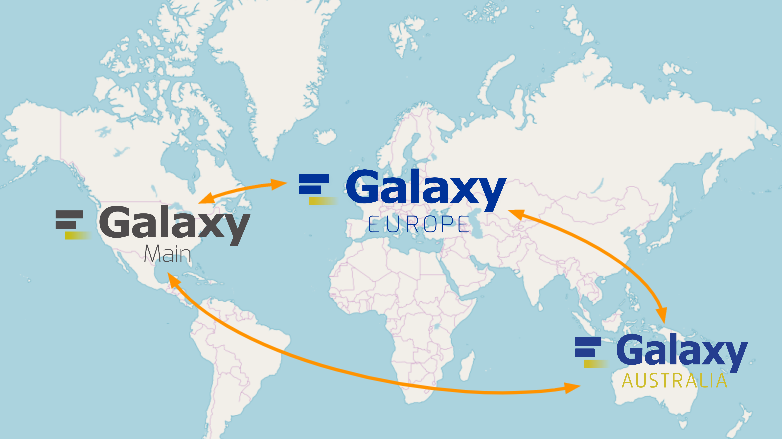
UseGalaxy.*: Galaxy Australia (UseGalaxy.org.au), Galaxy Europe (UseGalaxy.eu), Galaxy France (UseGalaxy.fr), Galaxy Main (UseGalaxy.org)
.image-50[
 ]
] - Many other smaller, often domain-specific Galaxies available
- List of all public Galaxies (135+): galaxyproject.org/use
Speaker Notes
- There are three main Galaxy servers: Galaxy Main, Galaxy Europe, and Galaxy Australia.
- These three Galaxies have the biggest teams behind them, and offer the most tools and resources.
- You can register an account for free on any of these servers.
- In addition, there are many smaller Galaxy servers to choose from.
- Many of these are domain-specific. For example, Galaxy Proteomics focuses on proteomics tools and workflows.
- A lot of universities and other institutions have local private servers.
The Galaxy Interface
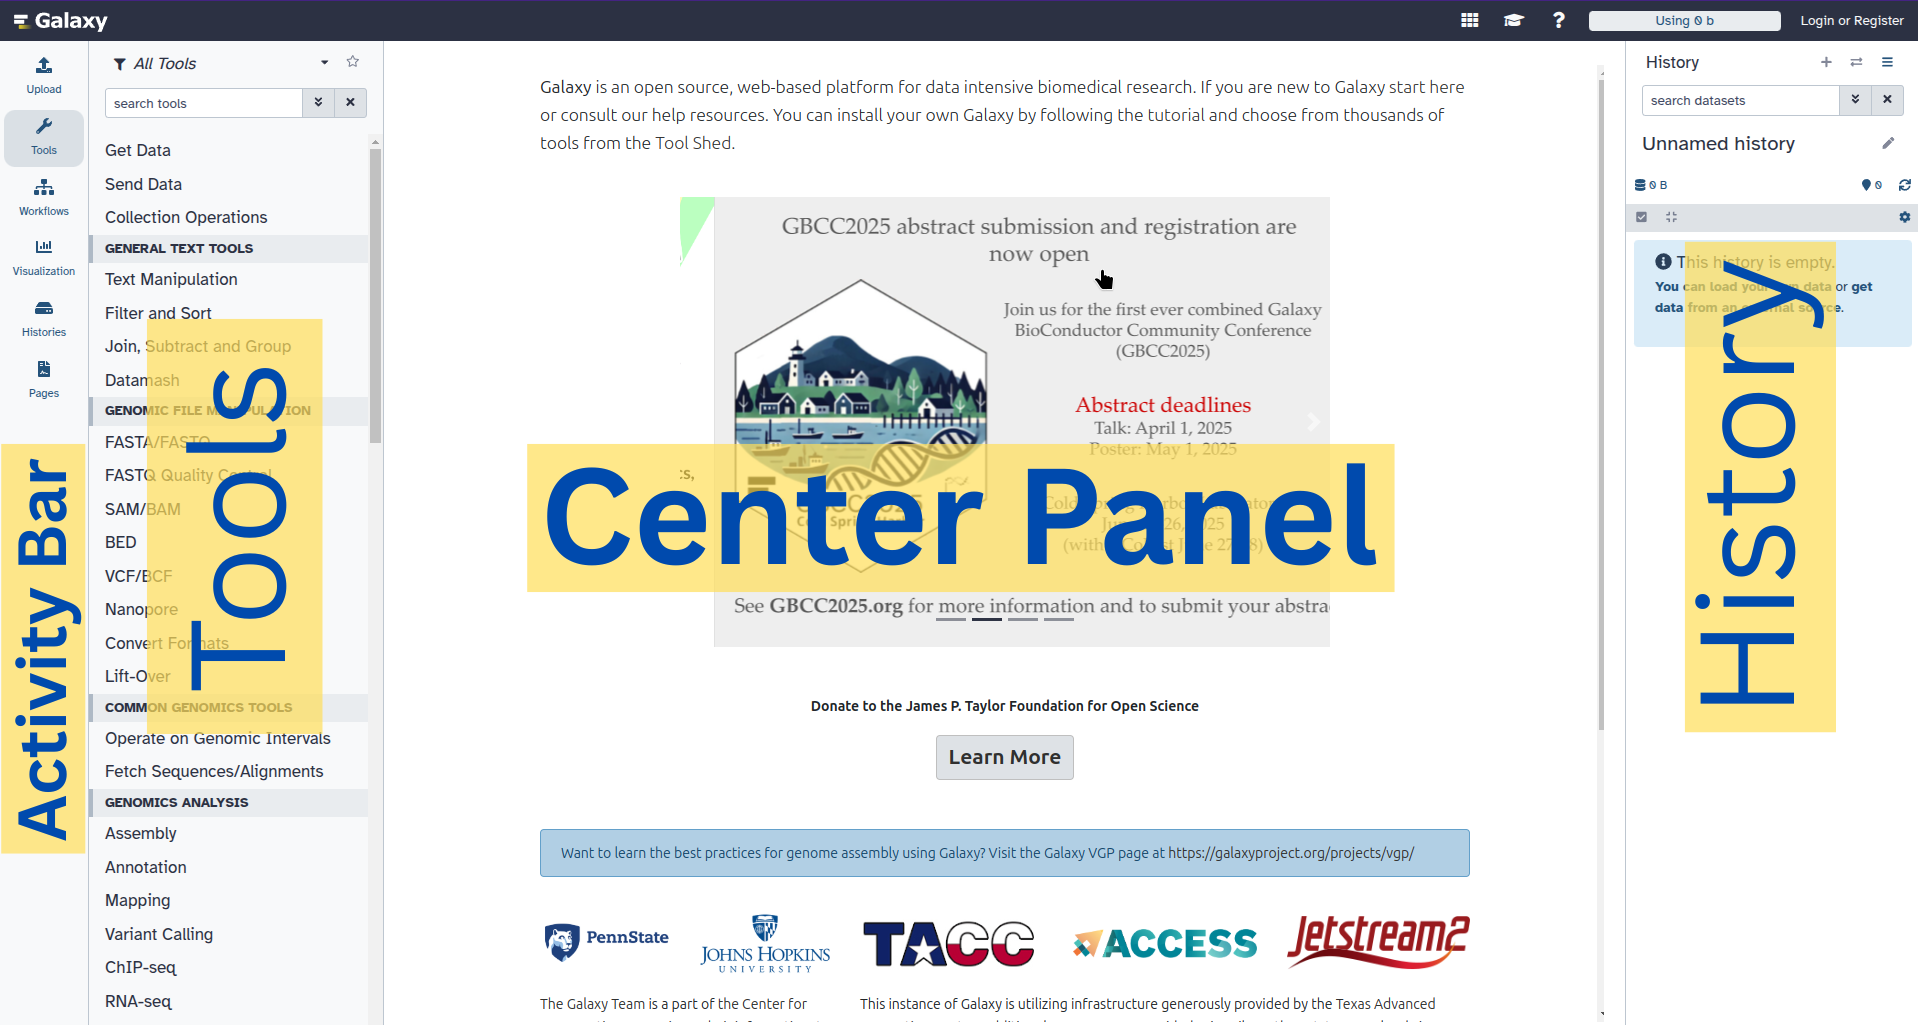
- Four main sections (left to right):
- The Activity Bar on the left: To navigate to the resources in Galaxy (Tools, Workflows, Histories etc.)
- Currently active Activity Panel next to it: By default, the tool Tools activity
- Viewing panel in the middle: The main area for context for your analysis
- Full record of your analysis: History at the very right
Speaker Notes
- The Galaxy user interface consists of four main parts.
- On the very left is the Activity Bar that lets you navigate to the different resources in Galaxy; such as Tools, Workflows, Histories and more.
- Next to it is the Activity Panel, which opens for some activities, such as the Tool Panel that is expanded for the Tools activity by default. This panel can easily be toggled in and out by clicking the associated activity.
- In the middle panel, you will run your analysis tools, view your data and results, view and edit workflows, etc. It is the main area for context for your analysis.
- On the right is a full record of your analysis; that is: Your History.
Uploading data
.pull-left[
-
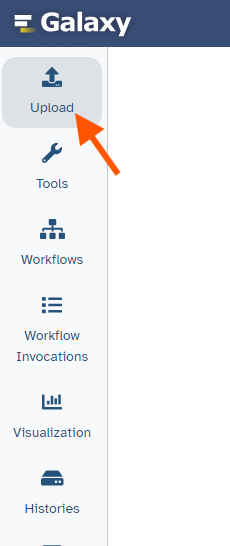
Upload from your computer
-
Import files from URL
-
Import from public data stores and repositories
- UCSC, NCBI, ENA, Zenodo and many more…
]
.pull-right[
 ]
]
Speaker Notes
- The first step of an analysis is to get your data into Galaxy.
- This can be done in several ways.
- You can upload files from your computer.
- Or you can enter an Internet URL, and Galaxy will download the data for you.
- Furthermore, Galaxy can import data directly from many online data stores such as UCSC, NCBI, and many more.
History
.pull-left[
-
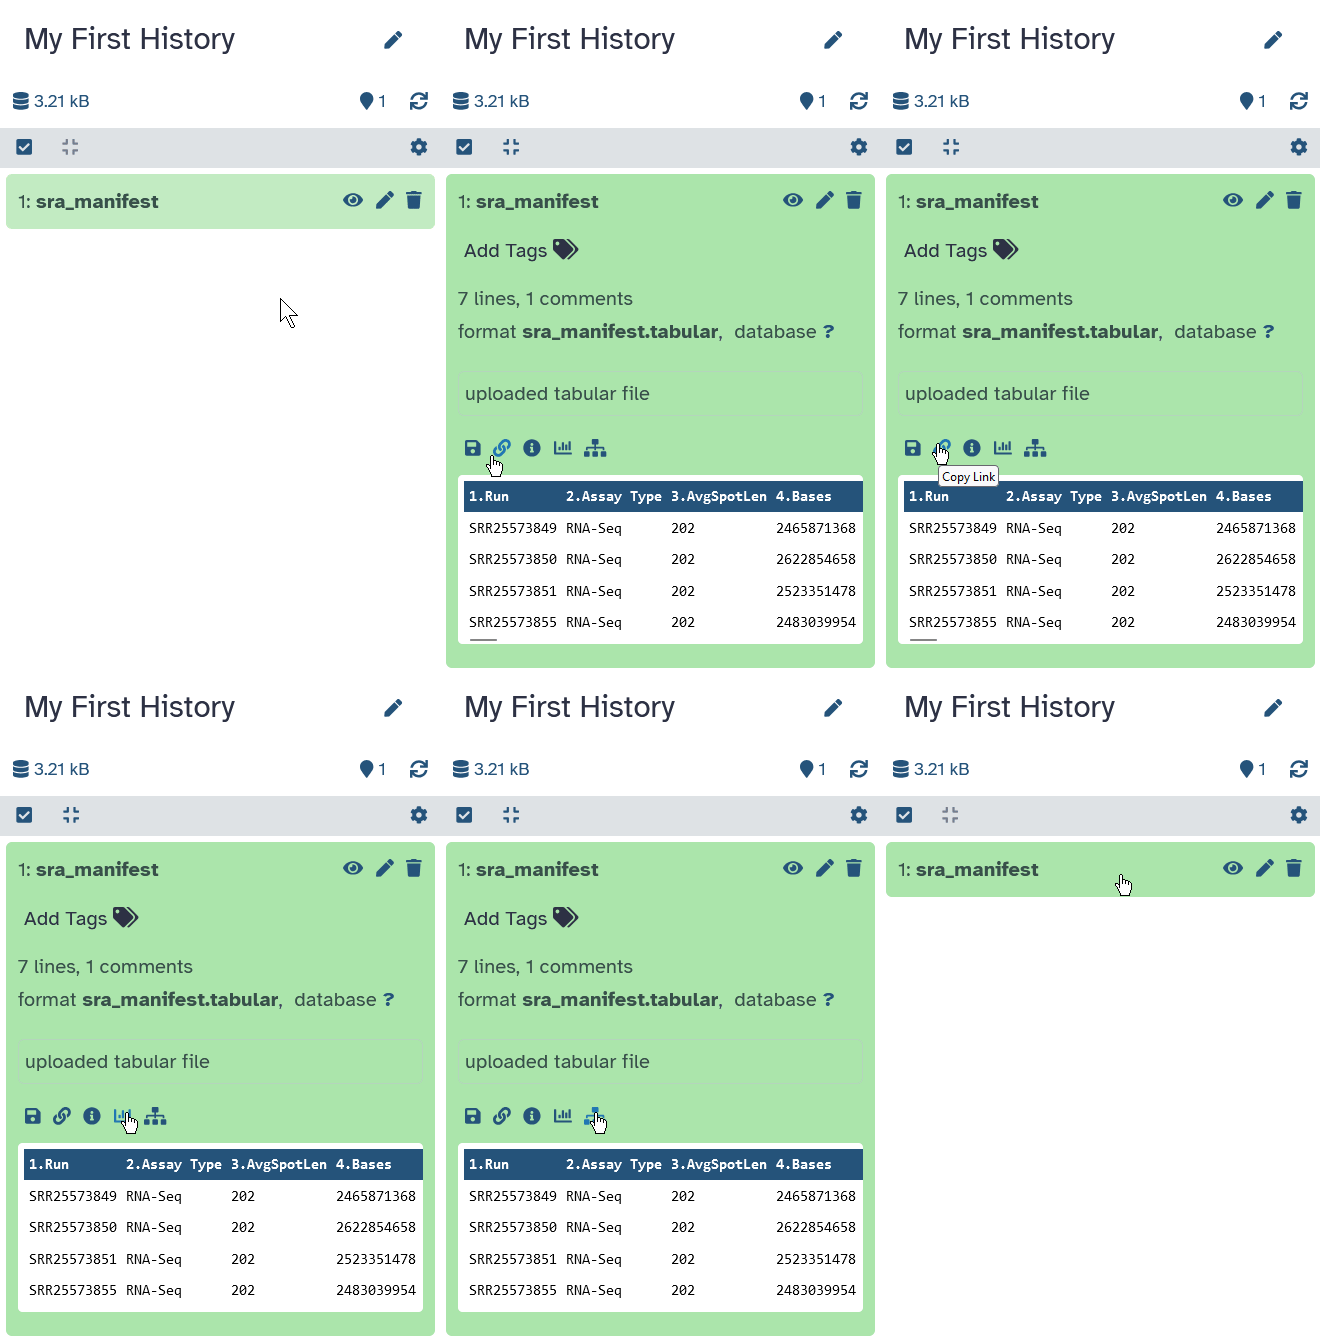
The history collects all the files of your analysis
- Three buttons
- galaxy-eye View the file
- galaxy-pencil Edit attributes
- e.g. change name
- galaxy-delete Delete file
- Click to expand
- file information
- format, size, …
- file preview
- file options
- download, visualize, …
- file information
]
.pull-right[
 ]
]
Speaker Notes
- All files you upload will appear in your history.
- There are 3 buttons on each dataset in your history.
- The eye icon lets you view the dataset. This will show up in the middle panel of Galaxy.
- The pencil icon allows you to edit the attributes of the file. For example, you can change the file name here.
- The trash icon lets you delete the dataset from your history.
- You can also click on the dataset to expand it. This will show more information and more options.
Finding a tool
.pull-left[
- Explore tool panel sections
- Enter name in Tool search box ]
.pull-right[
 ]
]
- galaxy-star Star your favorite tools to make them easier to find

Speaker Notes
- After your data is uploaded, you are ready to run tools.
- You can find tools by exploring the Tool Panel expandable on the left.
- If you already know the name of the tool you want to use, you can enter this in the search box at the top of the tool panel.
- If you have found a tool you like, you can add it to your favorites by clicking the star at the top of the tool.
Running a tool
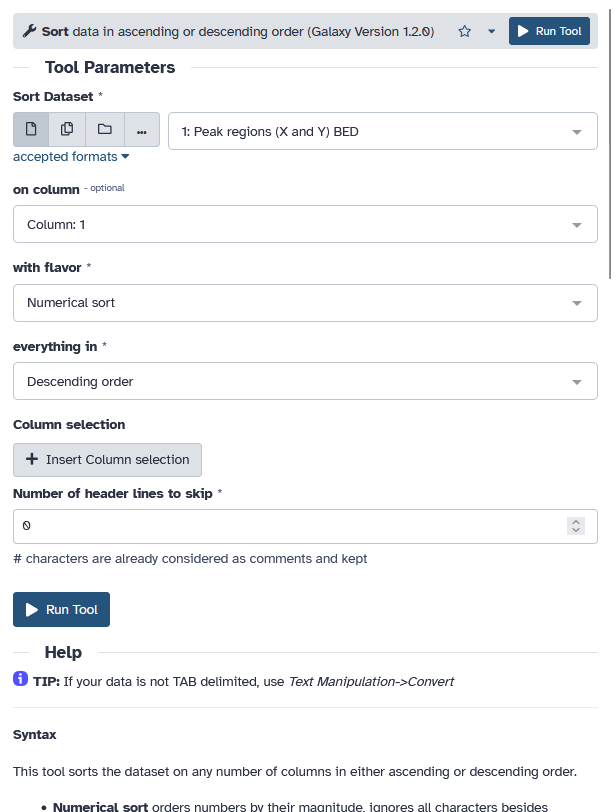
.pull-left[
- Choose input files
- Set tool parameters
-
Execute
- Below tool form:
- Help information
- Tool citation
]
.pull-right[
 ]
]
Speaker Notes
- When you click on a tool, it will show up in the middle panel.
- Here you can select your input files and set the parameters for the tool.
- Then you can hit the Execute button to start the tool.
- Older versions of a tool are usually kept available to ensure reproducibility.
Analysis Results
.pull-left[
-
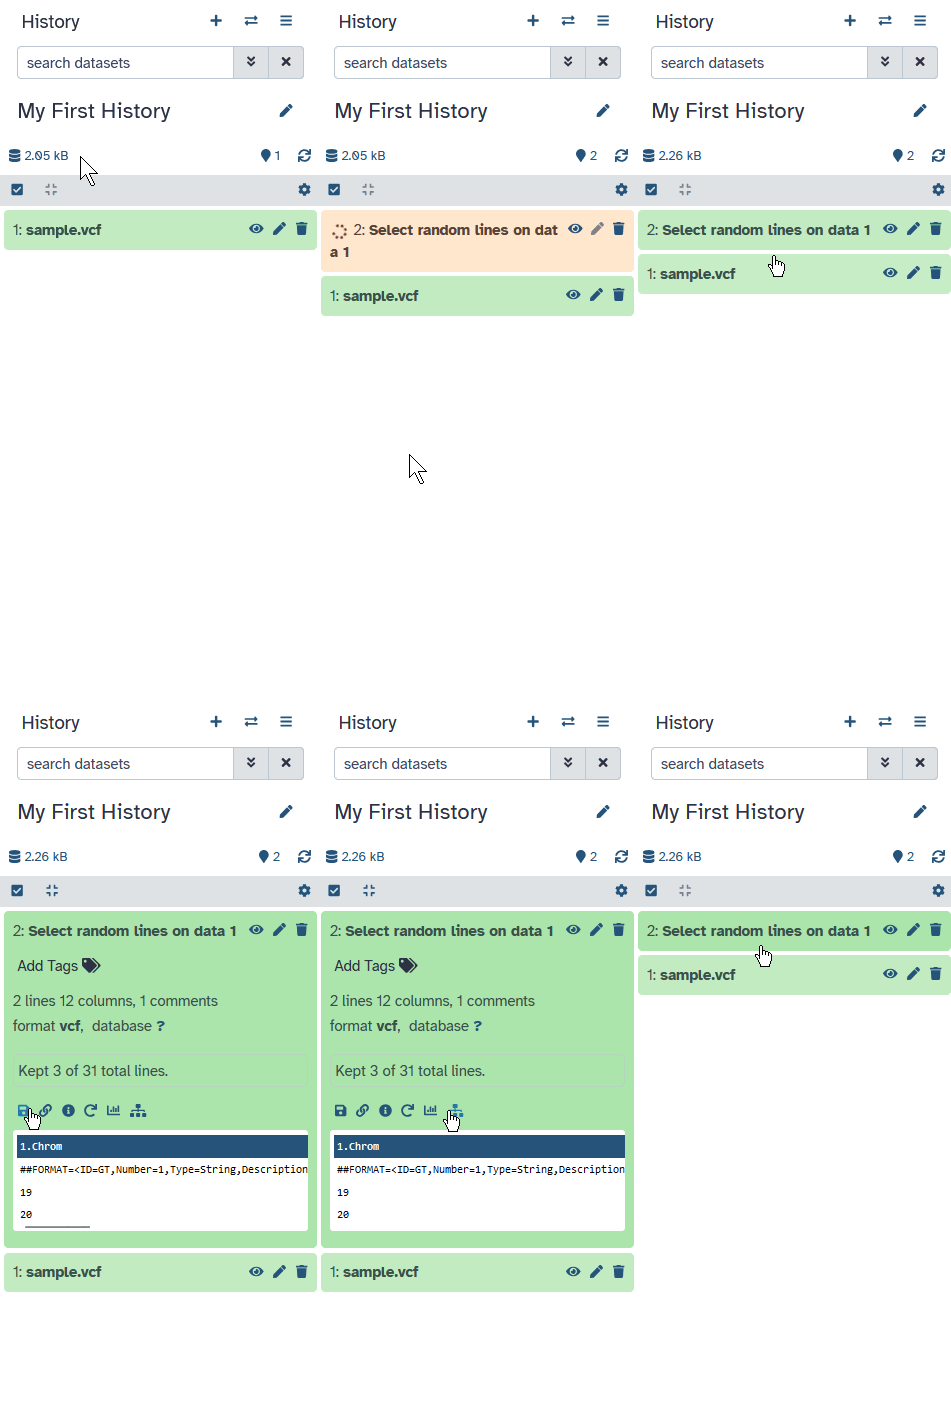
Tool outputs are added to the history
- Different dataset states
- waiting , running , success, failed
- Expand for more options
- galaxy-save Download dataset
- galaxy-info Information about tool run
- galaxy-refresh Reload tool with the same parameters
- galaxy-barchart Visualize dataset
- dataset-related-datasets Show Related Items (inputs/outputs) for this dataset
- Red dataset?
- galaxy-bug Click Bug icon
- view error message
- submit error report ]
- galaxy-bug Click Bug icon
.pull-right[
 ]
]
Speaker Notes
- The results of the analysis will be added to your history.
- You will see these output files go through various states.
- When a dataset is grey, it means it is waiting to run.
- When it turns orange, it means the tool is running.
- When the tool is finished, the outputs will turn green if the tool ran successfully.
- You can then click on the history item to get more information and options.
- For example, you can download the file to your computer.
- Or you can reload the tool with the same parameters.
- There is also an option to visualize your data.
- And another one to view items related to the dataset; such as files that were inputs to jobs that created it, etc.
- If there was a problem with the tool, it will turn red.
- You can click on the bug icon to view the error message or submit an error report to the Galaxy administrators.
Visualisations
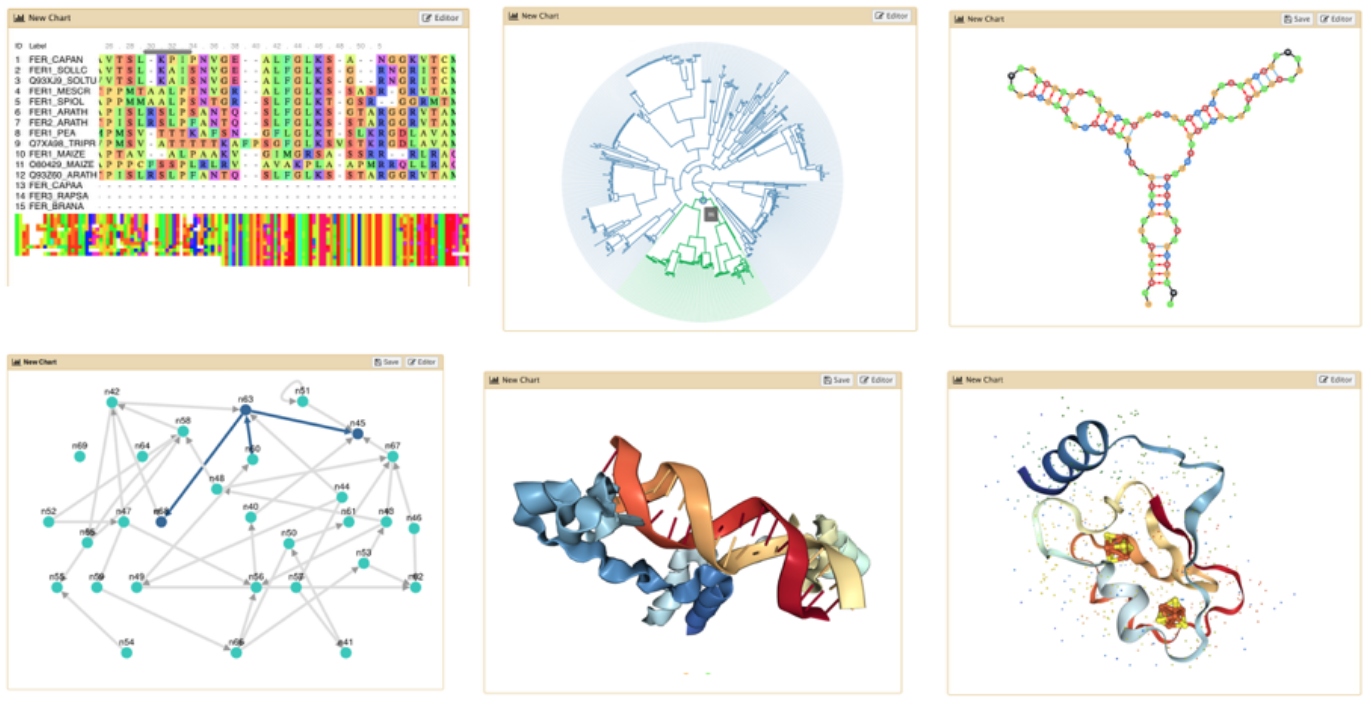
- Galaxy has many options to visualize data
Speaker Notes
- Galaxy offers several ways to visualize your datasets depending on their format.
- For example, protein PDB data can be seen in a 3D viewer.
Multiple Analyses
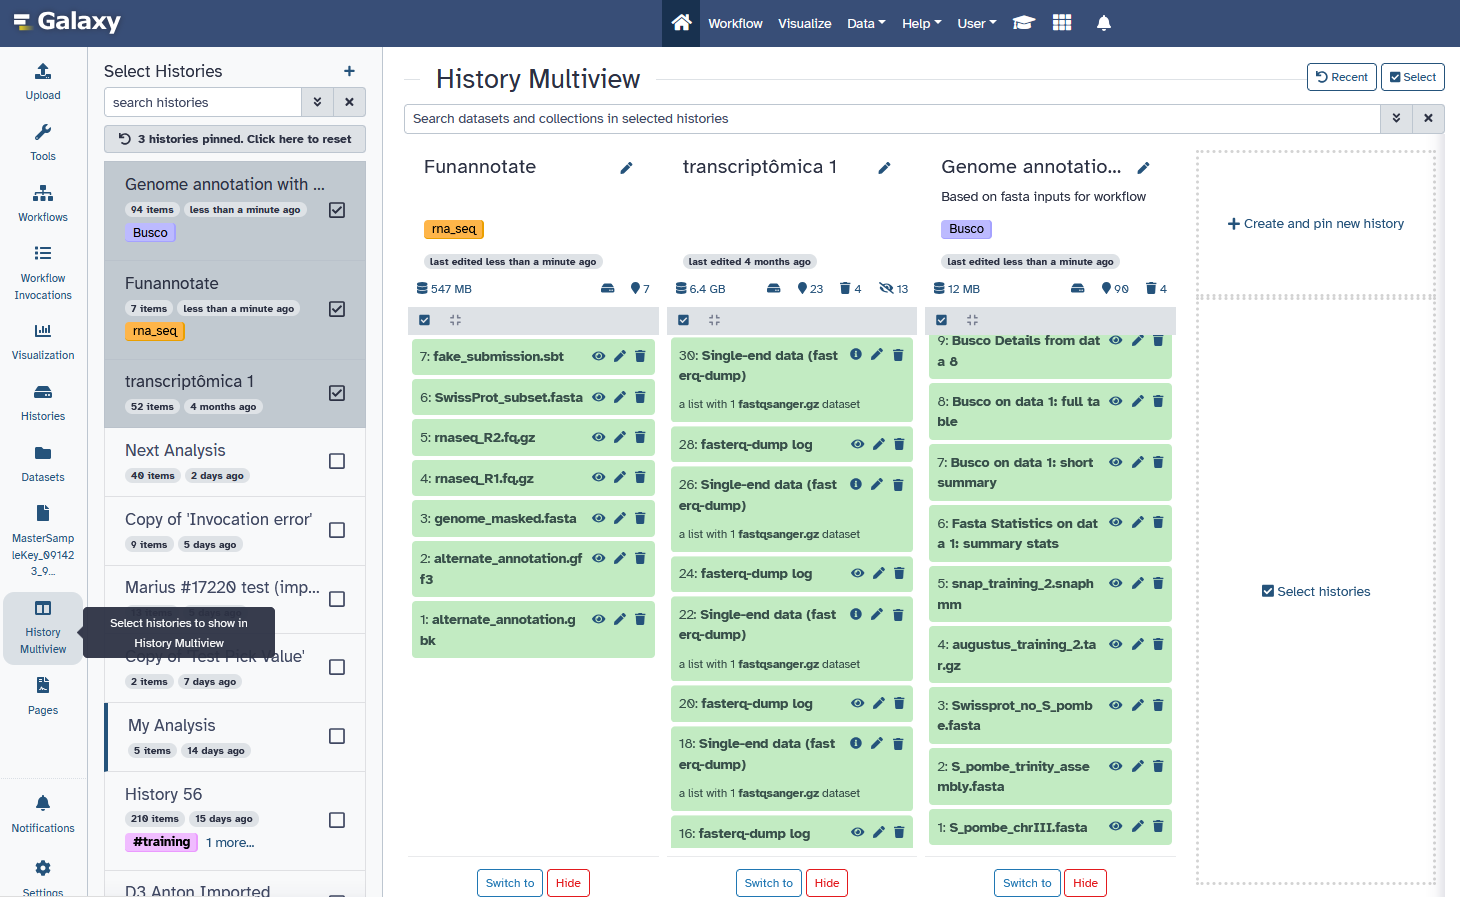
- Starting a new analysis? Create a new history new-history
- You can have as many histories as you want
- Overview of all your histories: Click on galaxy-history History Multiview activity
- Good names (tags, descriptions) for your histories help to keep track of your analyses
Speaker Notes
- When you want to start a new analysis, create a new history using the plus icon at the top of the history panel.
- You can always go back to an old history, and there is no limit on the number of histories you can create.
- An overview of your histories is available, where you can easily copy files around.
- Copying datasets instead of re-uploading them lets you save on your quota.
- Giving your histories good names will help you keep track of your analyses.
Workflows
- Run end-to-end analyses with one click
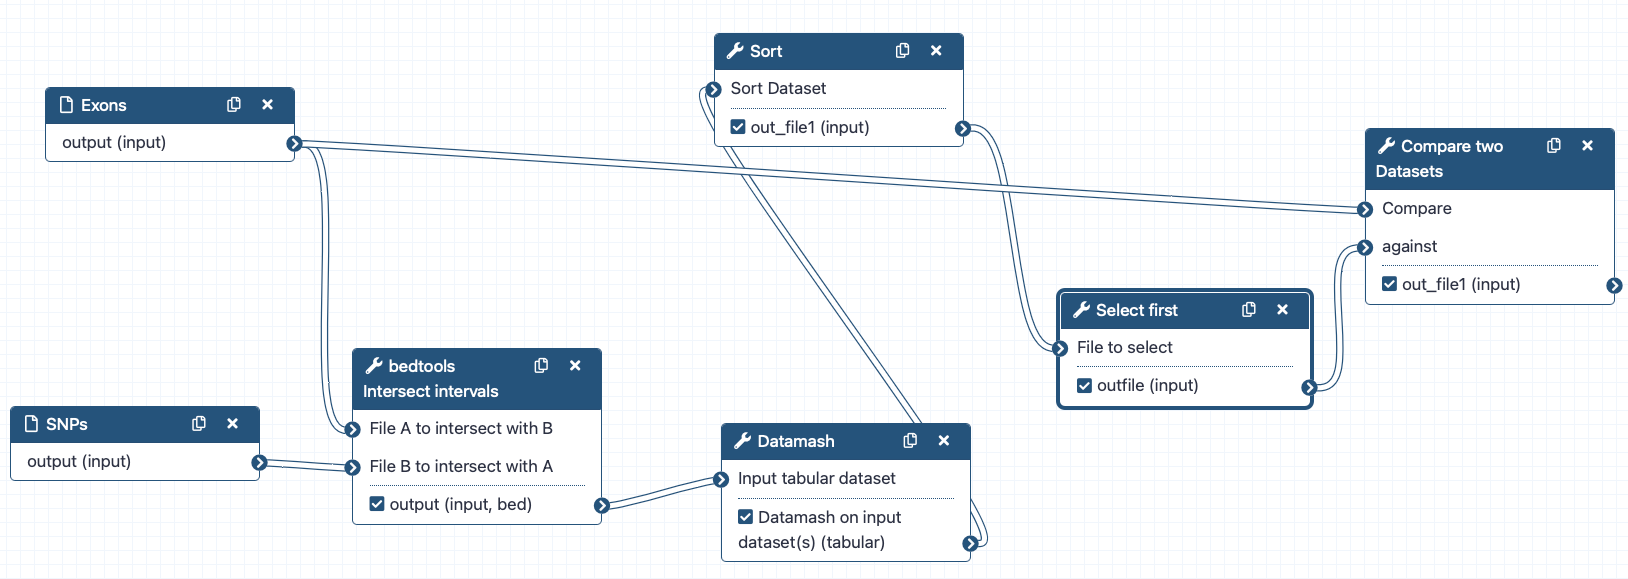
- Extract from a history
- Build manually with workflow editor
- Import a shared workflow
Speaker Notes
- Workflows let you run your analyses very easily by connecting tools’ outputs and inputs.
- There are multiple ways to create a workflow.
- Workflows can be automatically extracted from a history.
- This means you perform the analysis manually once, and then can easily repeat it on different input data.
- You can also build workflows by hand using the workflow editor to connect the tools.
- Or you can import a workflow somebody else has shared with you or published to the workflows list.
Sharing
.pull-left[
- You can share everything you do in Galaxy
- Histories, Workflows, Visualizations
- Sharing options
- Share with specific users
- Share via link
- Publish to make it visible to everybody ]
.pull-right[
 ]
]

Speaker Notes
- Everything you do in Galaxy can be shared.
- You can share your history, your workflow, and your visualizations.
- There are different ways to share your work.
- You can either share it with specific Galaxy users.
- Or you can get a share link that you can send to anybody.
- If you publish your work, it will be visible to everybody in the appropriate published tab of the resource you are sharing.
Learning Galaxy
- Galaxy Training Materials (training.galaxyproject.org)
<div class="row" style="color: var(--text-color-boxtitle)"> <div class="col-md-3"> <div class="gtn-card color-rainbow-orangered"> <div class="card-title">499</div> <div class="card-text">Tutorials</div> </div> </div> <div class="col-md-3"> <div class="gtn-card color-rainbow-orange"> <div class="card-title">35</div> <div class="card-text">Topics</div> </div> </div> <div class="col-md-3"> <div class="gtn-card color-rainbow-orangeyellow"> <div class="card-title">28</div> <div class="card-text">Learning Paths</div> </div> </div> <div class="col-md-3"> <div class="gtn-card color-rainbow-green"> <div class="card-title">489</div> <div class="card-text">FAQs</div> </div> </div> <div class="col-md-3"> <div class="gtn-card color-rainbow-blue"> <div class="card-title">347</div> <div class="card-text">Workflows</div> </div> </div> <div class="col-md-3"> <div class="gtn-card color-rainbow-purple"> <div class="card-title">214</div> <div class="card-text">Videos (147.5h)</div> </div> </div> <div class="col-md-3"> <div class="gtn-card color-rainbow-violet"> <div class="card-title">123</div> <div class="card-text">News Posts</div> </div> </div> <div class="col-md-3"> <div class="gtn-card color-rainbow-pink"> <div class="card-title">10.6</div> <div class="card-text">Years</div> </div> </div> </div> <h2 data-toc-skip> Community Stats </h2> <div class="row" style="color: var(--text-color-boxtitle)"> <div class="col-md-3"> <div class="gtn-card color-rainbow-orangeyellow h-100"> <div class="card-title">514</div> <div class="card-text">Contributors</div> </div> </div> <div class="col-md-3"> <div class="gtn-card color-rainbow-green h-100"> <div class="card-title">33</div> <div class="card-text">Editorial Board Members</div> </div> </div> <div class="col-md-3"> <div class="gtn-card color-rainbow-blue h-100"> <div class="card-title">44</div> <div class="card-text">Events</div> </div> </div> <div class="col-md-3"> <div class="gtn-card color-rainbow-violet h-100"> <div class="card-title">71</div> <div class="card-text">Supporting Organisations</div> </div> </div> </div>
Speaker Notes
- If you would like to learn more about Galaxy, there are a large number of tutorials available.
- These tutorials cover a wide range of scientific domains.
Getting Help
-
Help Forum (help.galaxyproject.org)

-
Chat on Matrix
- Main Chat
- Galaxy Training Chat
- Many more channels (scientific domains, developers, admins)
Speaker Notes
- If you get stuck, there are ways to get help.
- You can ask your questions on the help forum.
- Or you can chat with the community on Matrix.
Join an event
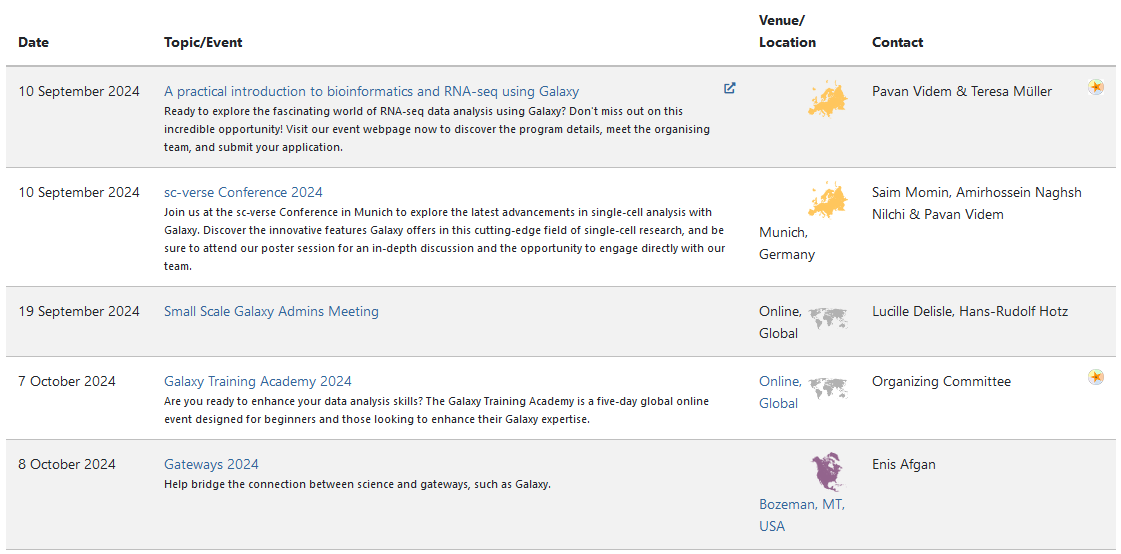
- Many Galaxy events across the globe
- Event Horizon: galaxyproject.org/events
Speaker Notes
- There are frequent Galaxy events all around the world.
- You can find upcoming events on the Galaxy Event Horizon.
Key Points
- Galaxy lets you perform complex data analysis right from your browser
- These analyses are *reproducible*; Galaxy keeps track of all the details of your analysis
- Galaxy has a very large and active user community
- There are many training materials available to learn Galaxy
Thank you!
This material is the result of a collaborative work. Thanks to the Galaxy Training Network and all the contributors! Tutorial Content is licensed under
Creative Commons Attribution 4.0 International License.