ChIP-seq data analysis
Contributors
Questions
What is ChIP-seq?
Objectives
Identify ChIP-seq data
last_modification Published: Sep 17, 2018
last_modification Last Updated: Mar 11, 2025
ChIP-seq
- Chromatin ImmunoPrecipitation combined with sequencing
- Identifying the location of proteins binding sites
- Transcription Factors
- Histone modifications
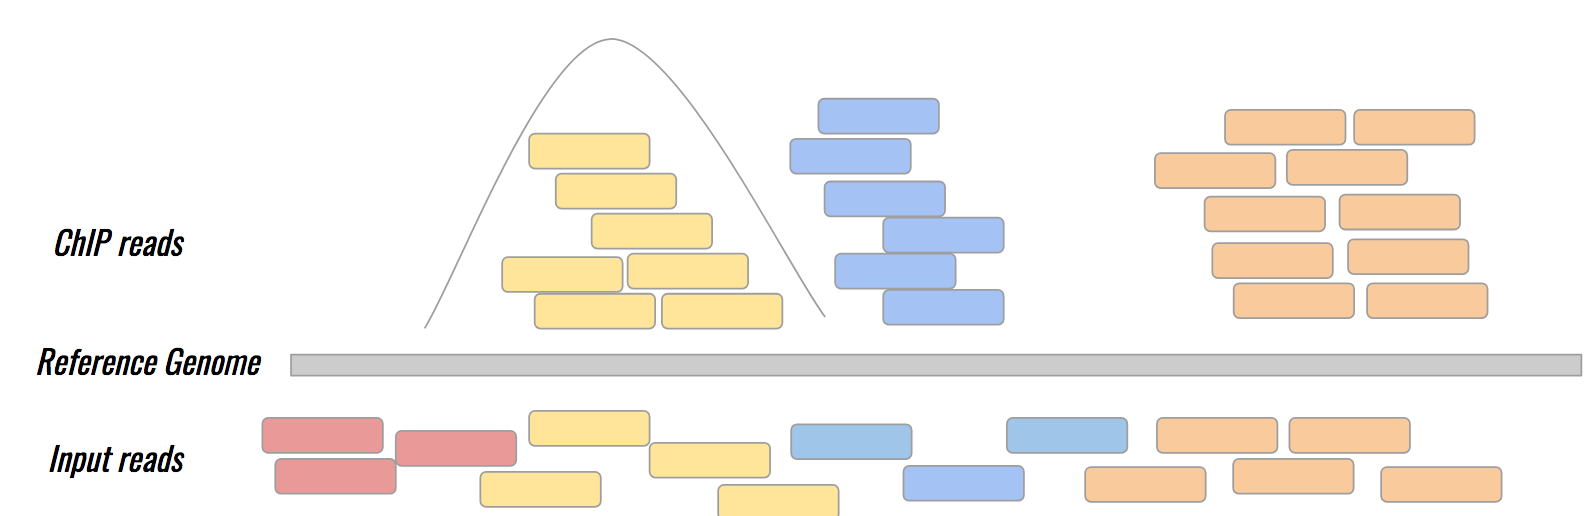
- 2 Types of sequenced data
- ChIP data
- Input data
.image-75[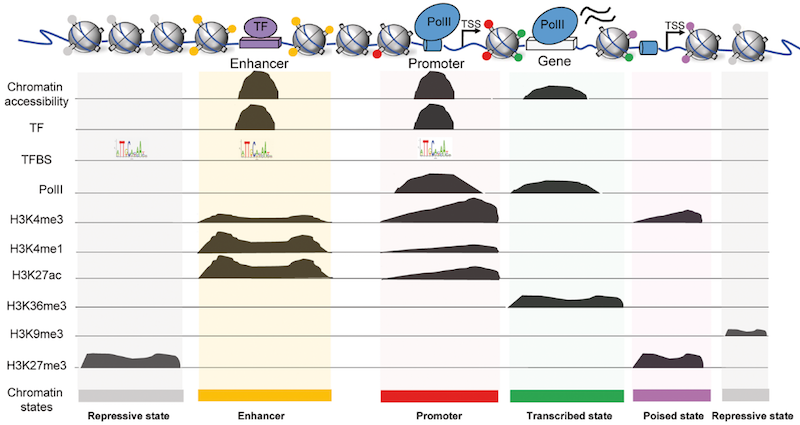 ]
]
Generating ChIP-seq data
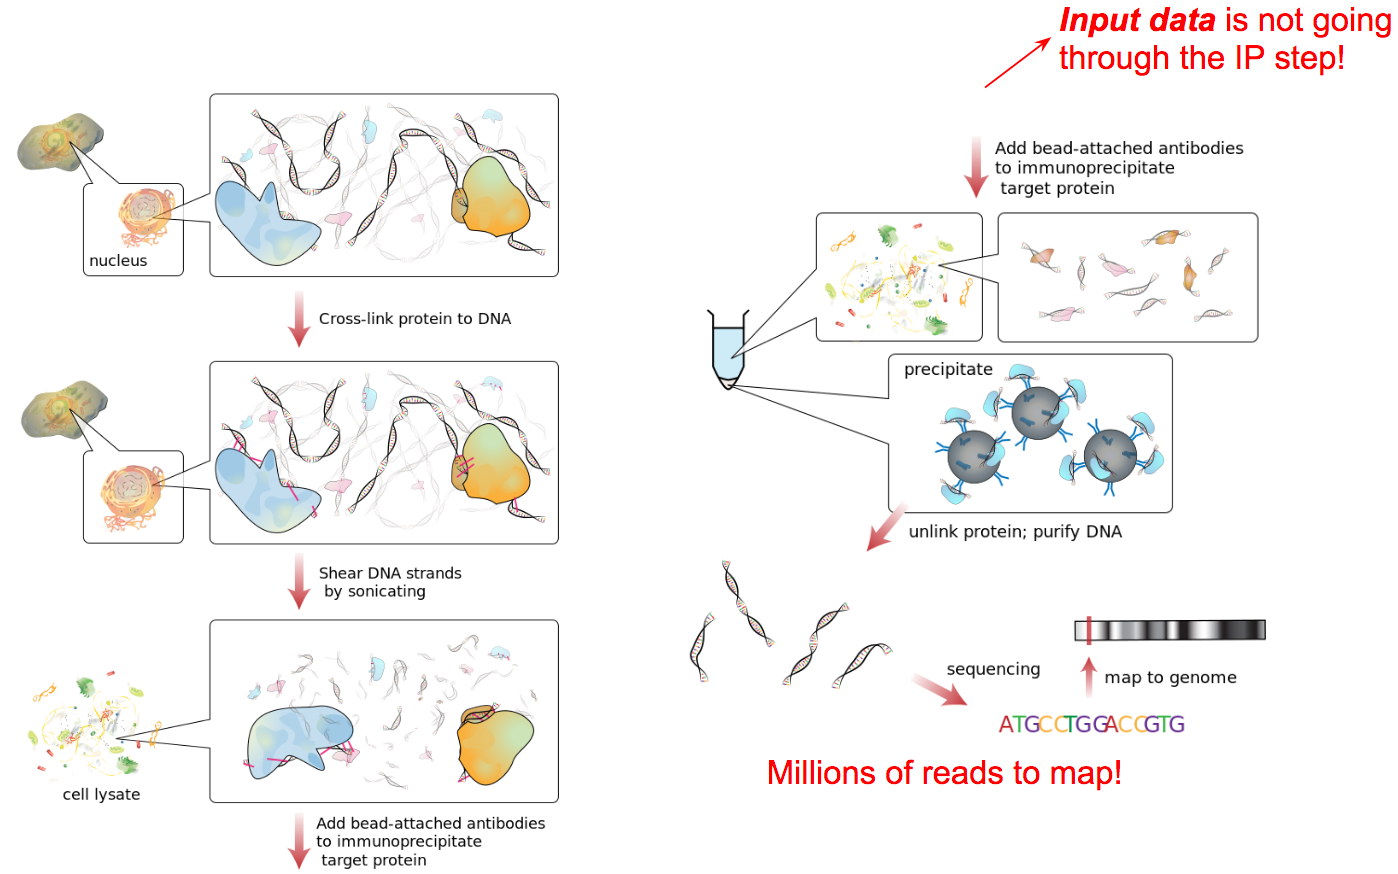
Source: Wikipedia
ChIP vs Input
Studying the effect of SCHMD1 protein in chromosome X
SCHMD1 is known to have an effect on gene expression in X chromosome
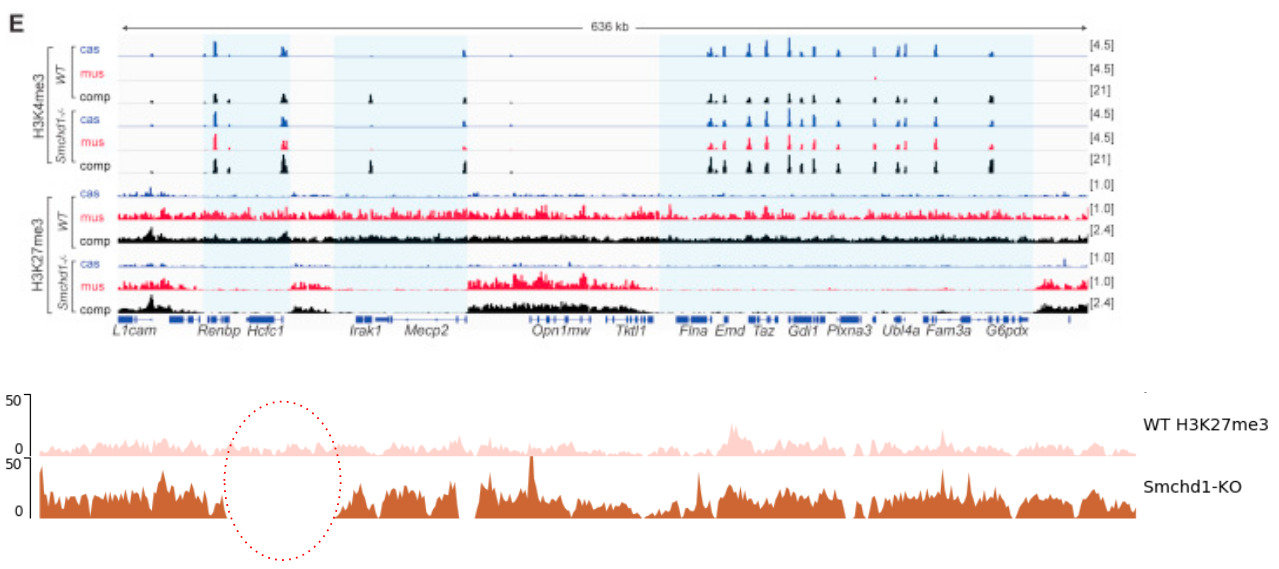
Chen-Yu Wang et al. 2018; Vivek Bhardwaj, Steffen Heyne et al. 2018
Speaker Notes We probe a potential architectural role for SMCHD1 and investigate the mechanism by which it shapes the Xi and represses gene expression
Key Points
Thank you!
This material is the result of a collaborative work. Thanks to the Galaxy Training Network and all the contributors! Tutorial Content is licensed under
Creative Commons Attribution 4.0 International License.
Tutorial Content is licensed under
Creative Commons Attribution 4.0 International License.