Mass spectrometry: LC-MS preprocessing - advanced
Contributors
last_modification Published: Feb 4, 2020
last_modification Last Updated: May 15, 2023
raw-to-matrix
From raw files to data matrix
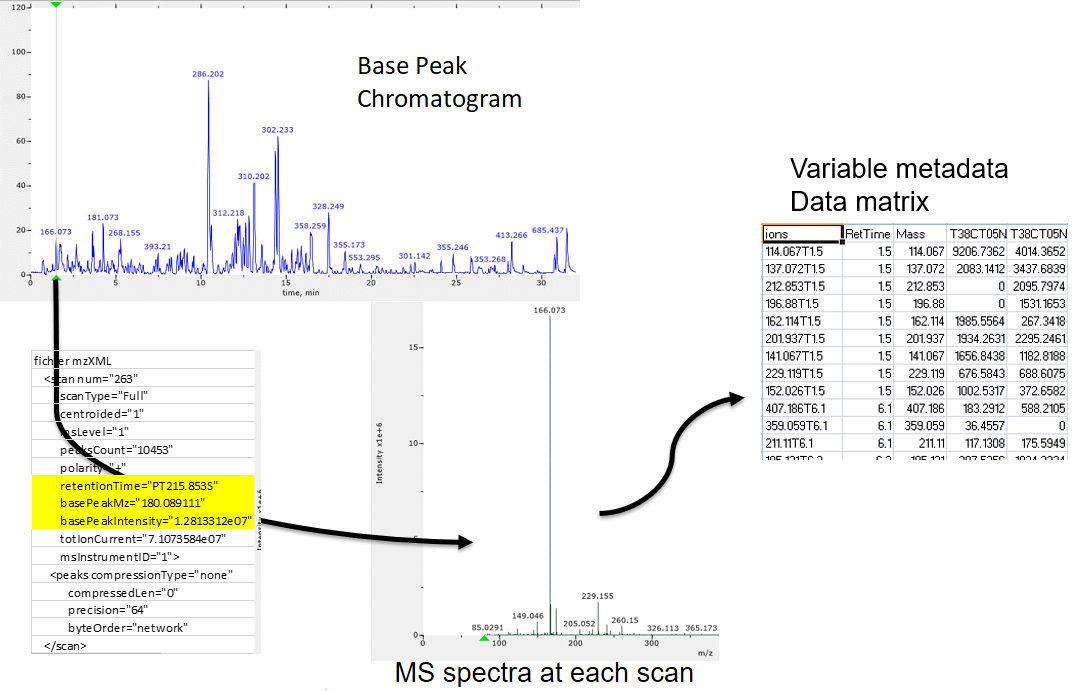
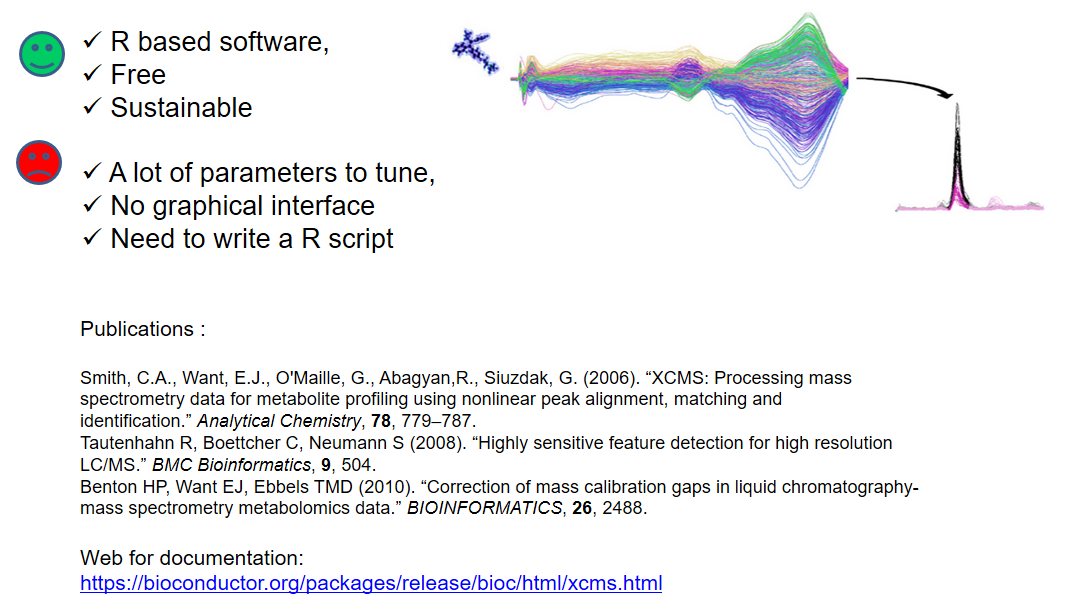
XCMS
findchrompeaks
xcms - findChromPeaks
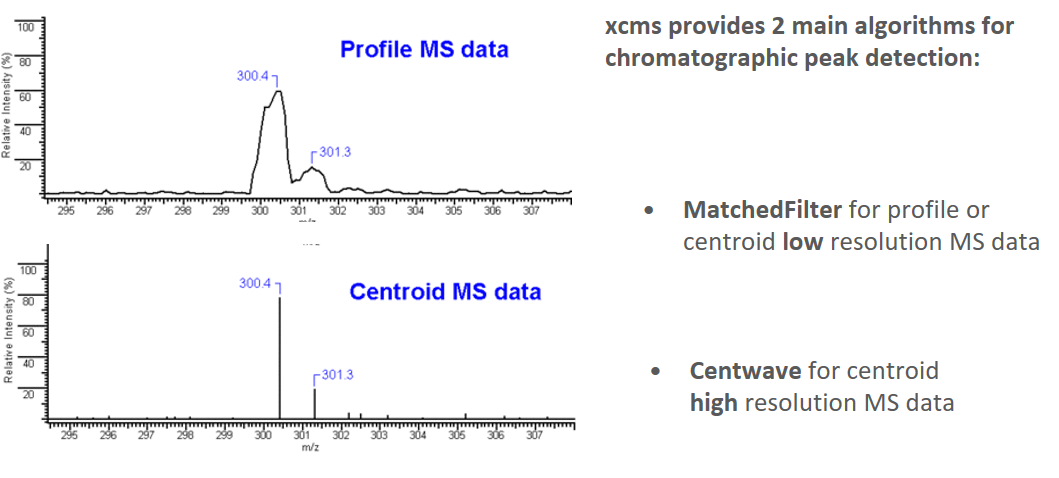
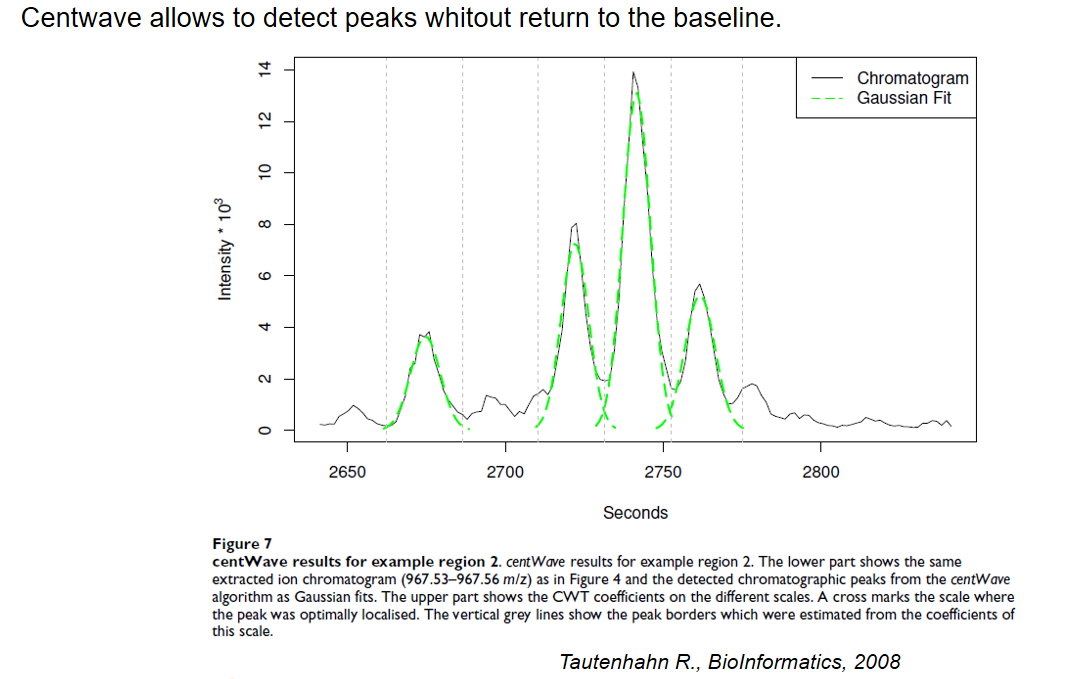
xcms - findChromPeaks - CentWave algorithm
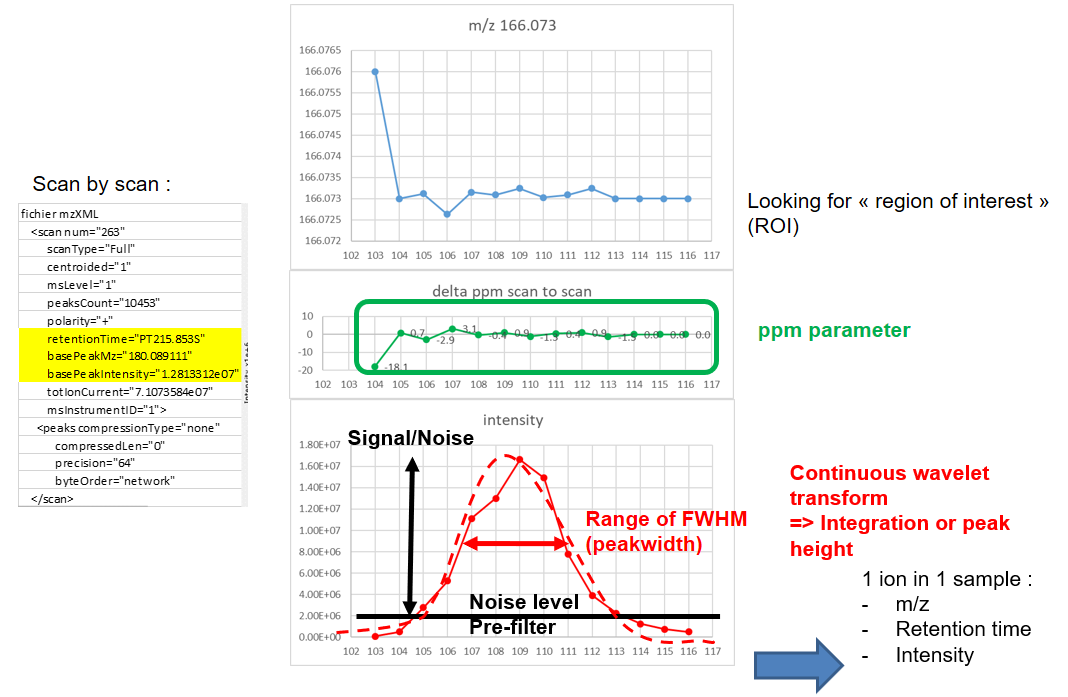
xcms - findChromPeaks - CentWave algorithm
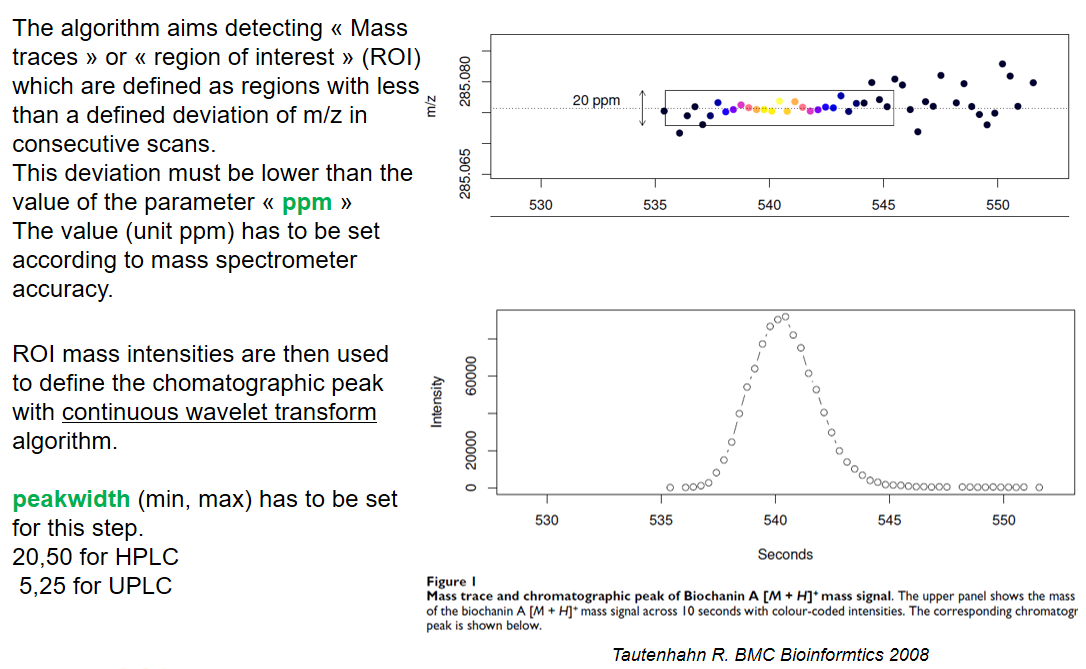
xcms - findChromPeaks - CentWave algorithm
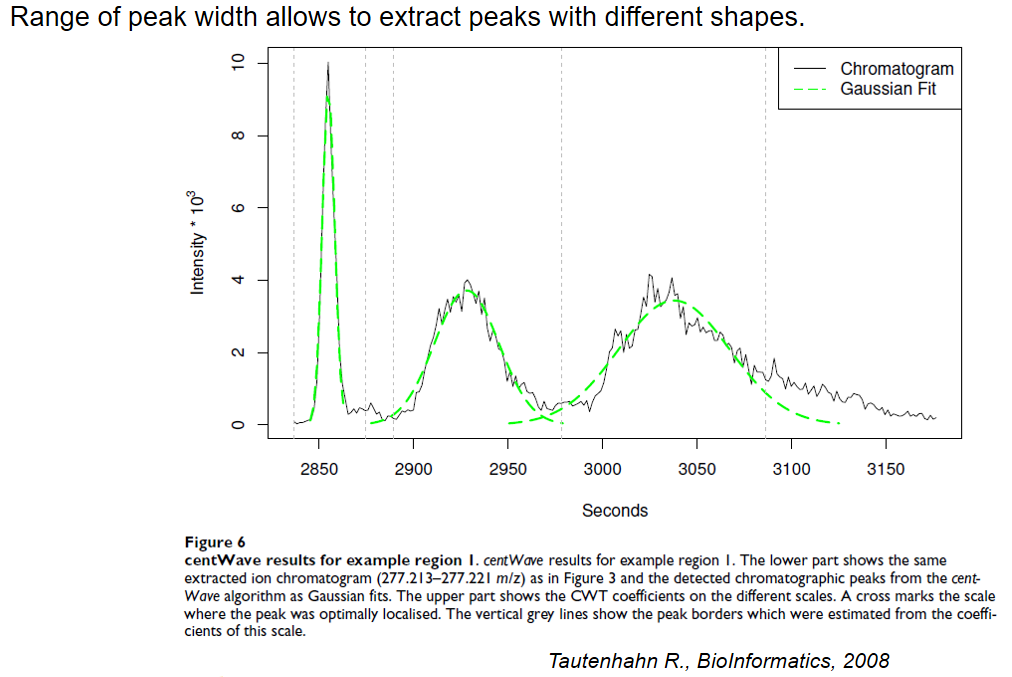
xcms - findChromPeaks - CentWave algorithm
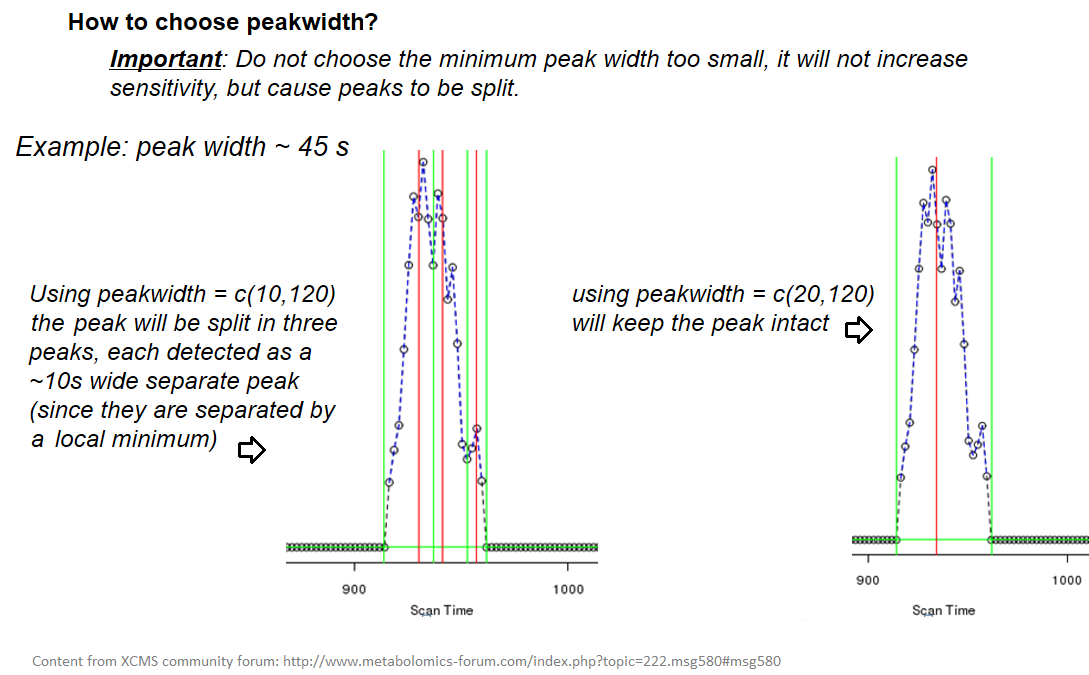
xcms - findChromPeaks - CentWave parameters
xcms - findChromPeaks - Parameters summary
| xcms parameters | related to | description | examples |
|---|---|---|---|
| ppm | m/z | fluctuation of m/z value (ppm) from scan to scan - depends on the mass spectrometer accuracy | 5… |
| peakwidth | retention time | range of chromatographic peak width (second) | UPLC 10,40 / HPLC 20,120 |
| mzdiff | m/z and retention time | minimum difference of m/z for peaks with overlapping retention time (coeluting peak) - must be negative to allow overlap | -0.001 or 0.05 |
| prefilter (k, I) | Intensity | a peak must be present in k scans with an intensity greater than I | k=3,I=1000 |
| snthresh | Intensity | signal/noise ratio threshold | 5… |
| noise | Intensity | each centroid must be greater than the “noise” value | . |
groupchrompeaks
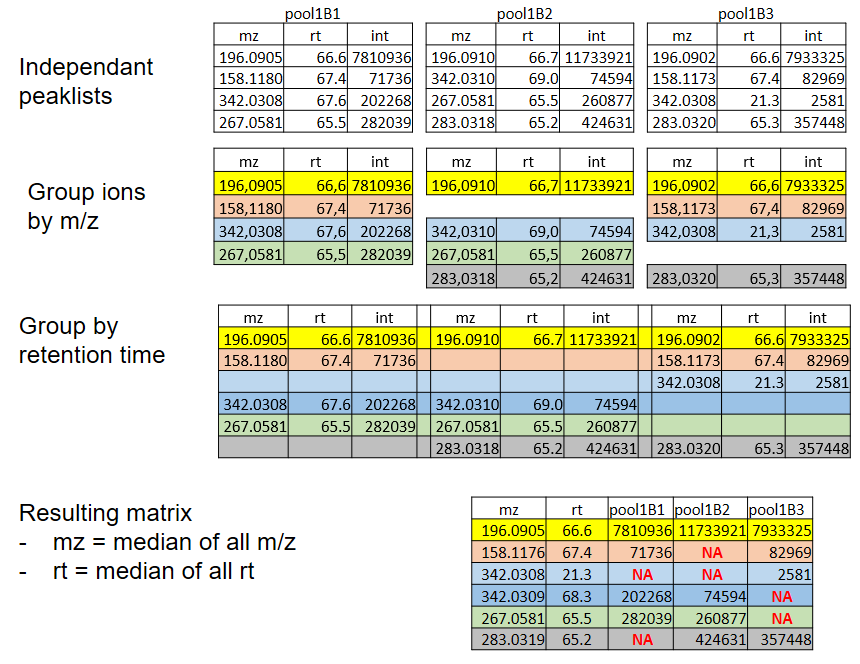
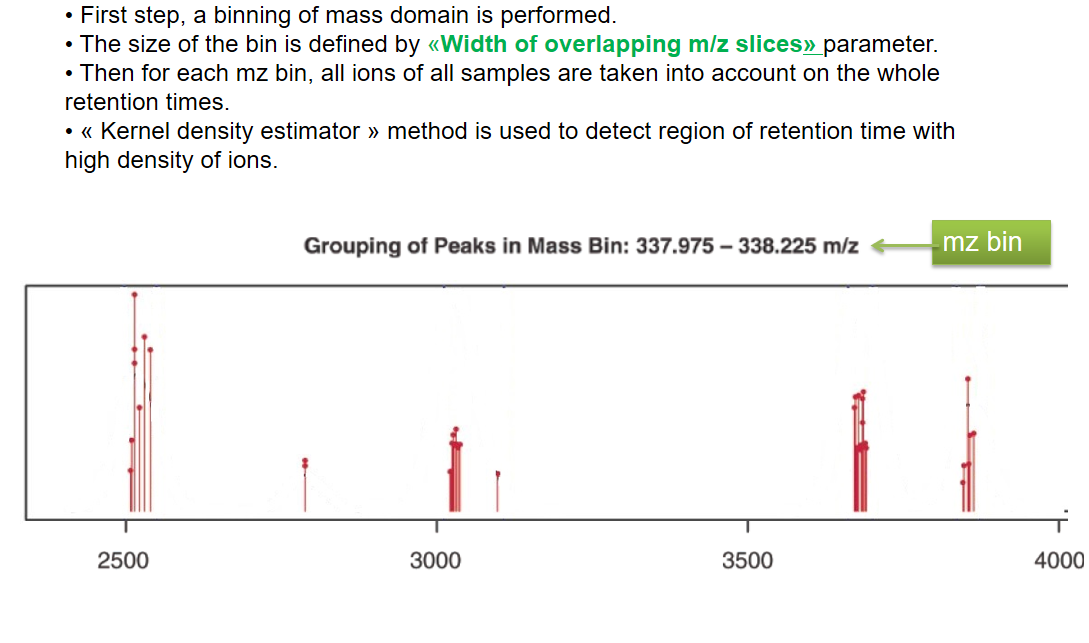
xcms - groupChromPeaks
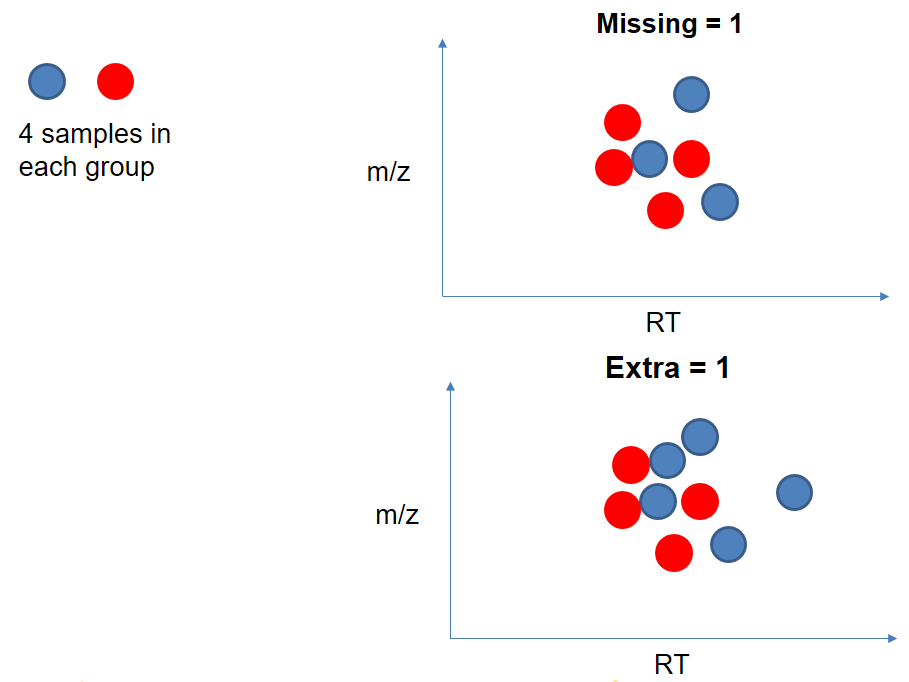
xcms - groupChromPeaks - Alignment group
xcms - groupChromPeaks - Alignment group
xcms - groupChromPeaks - Alignment group
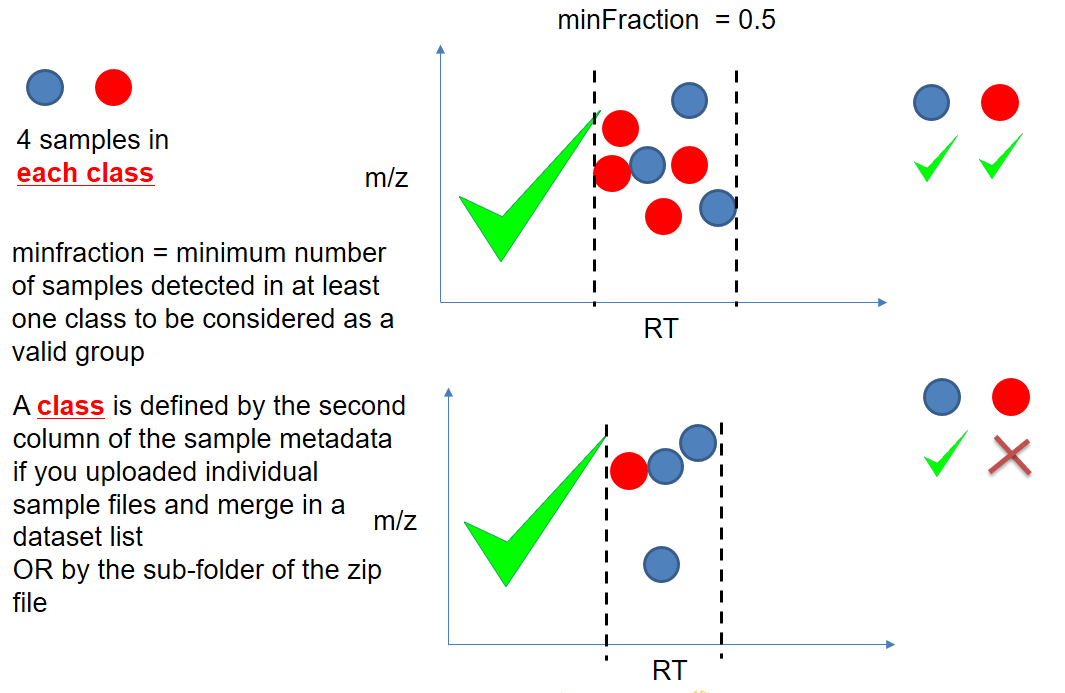
xcms - groupChromPeaks - minFraction parameter
xcms - groupChromPeaks - Output
xcms - groupChromPeaks - Output
xcms - groupChromPeaks - Parameters summary
| xcms parameters | related to | description | examples |
|---|---|---|---|
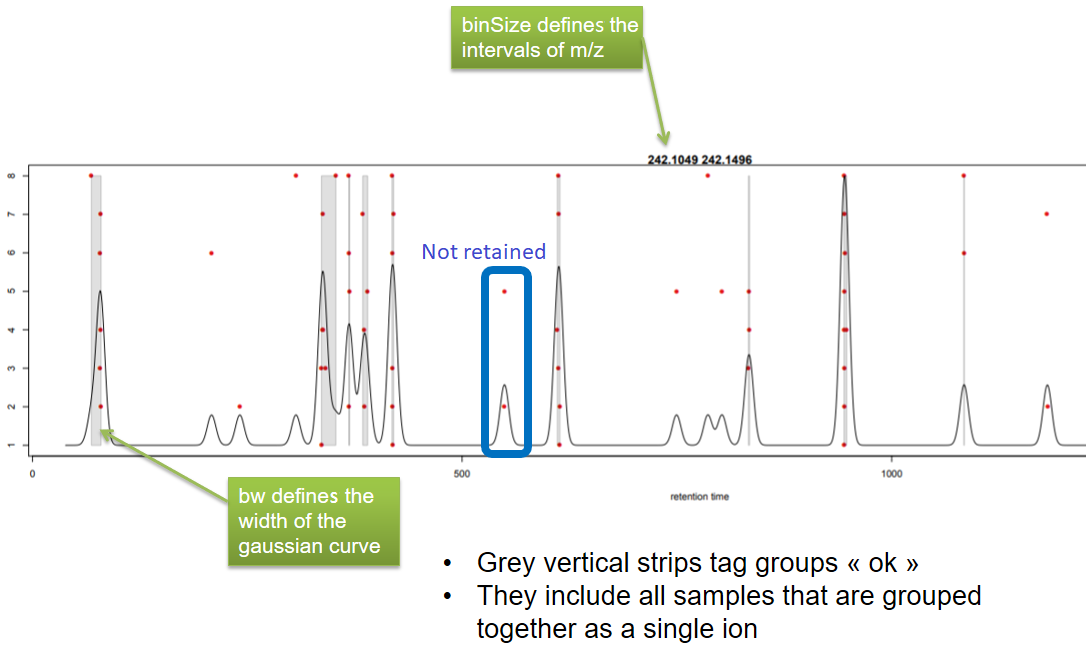
| binSize | m/z | Size of m/z slices (bins). Range of m/z to be included in a group. Depends on mass spectrometer accuracy. | |
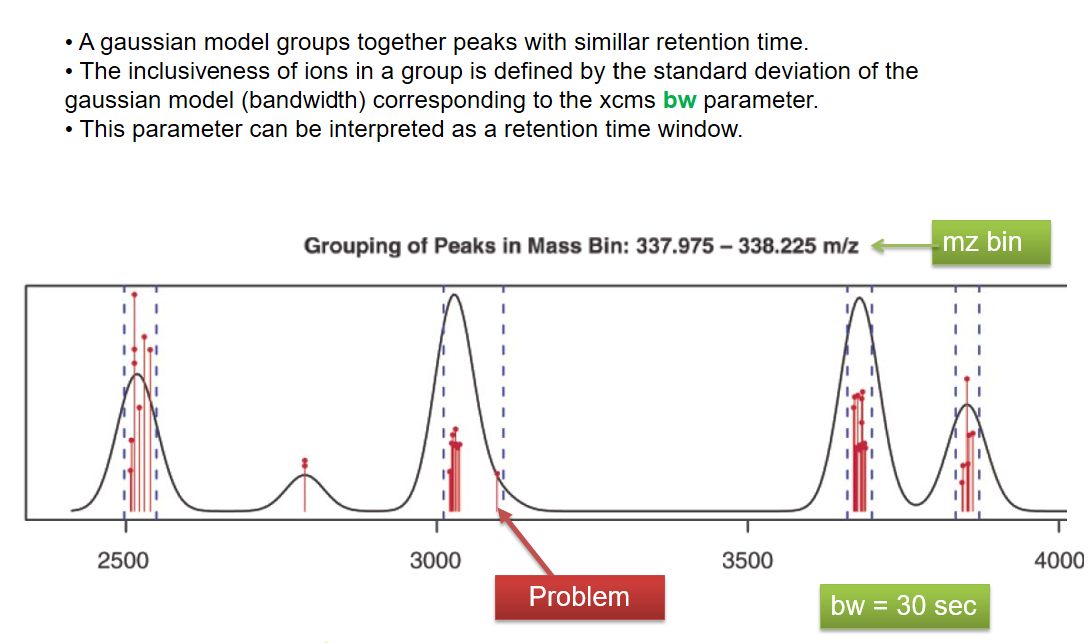
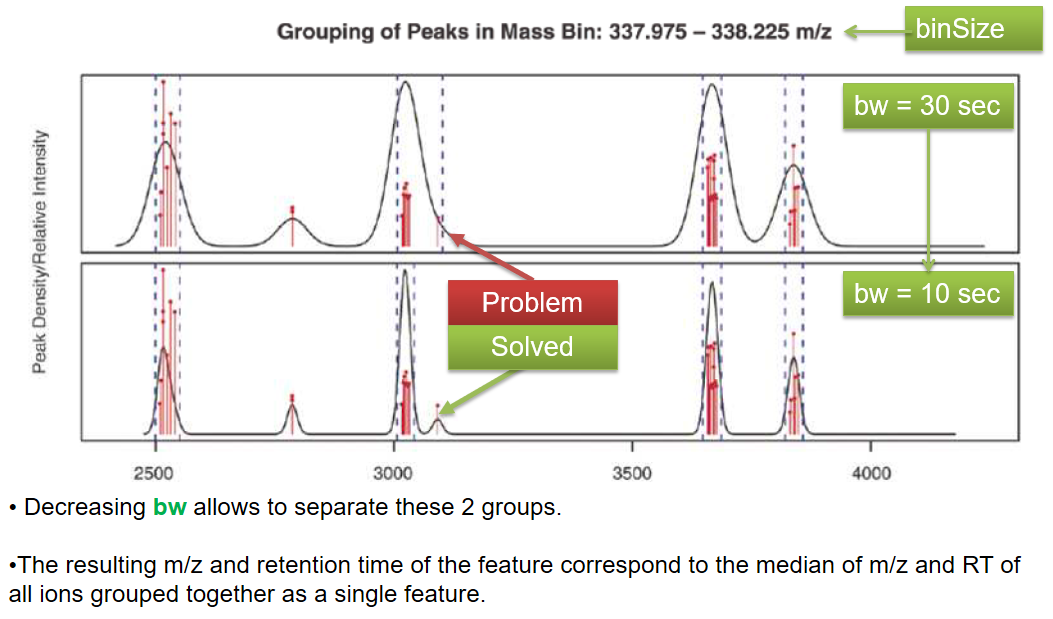
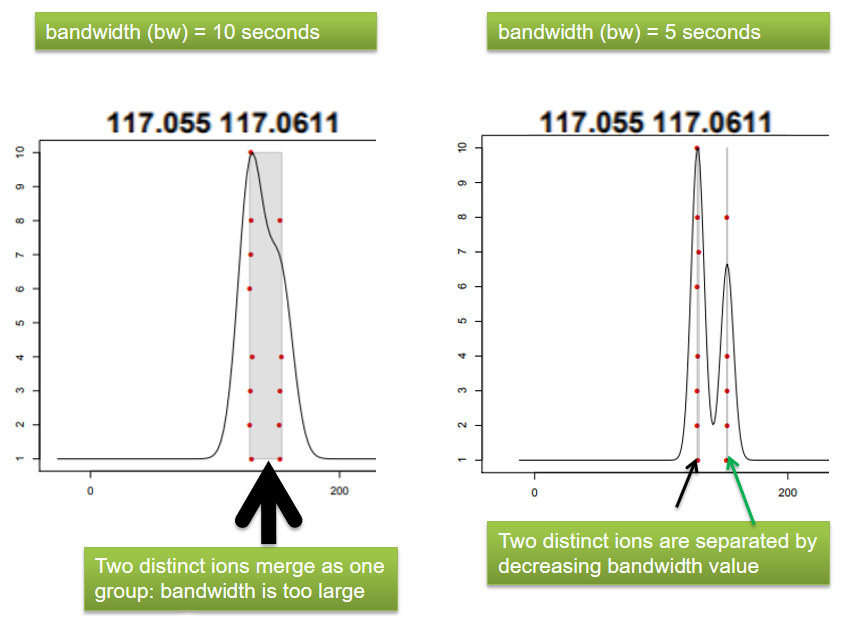
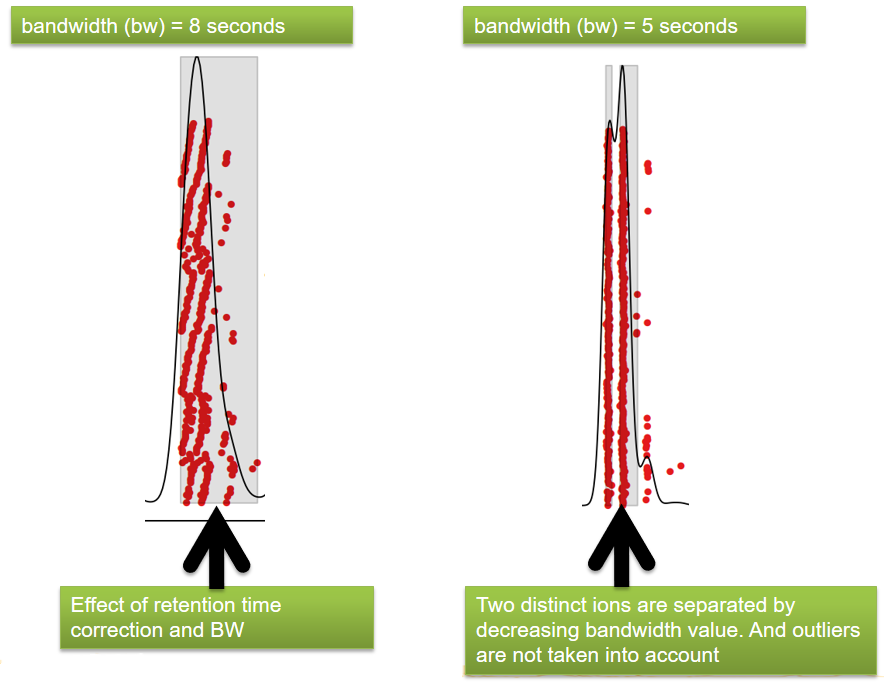
| bw | retention time | Standart deviation of the gaussian metapeak that group peaks together. | HPLC 30s / UPLC 5s |
| minFraction | samples | To be valid, a group must be found in at least minFraction*n samples, with n=number of samples for each class of samples. A minFraction=0.5 corresponds to 50%. | n=10, minFraction=0.5 => found in at least 5 samples |
| max | number of ions | Maximum number of groups detected in a single m/z slices. | 10 or 50 |
adjustrtime
xcms - adjustRtime
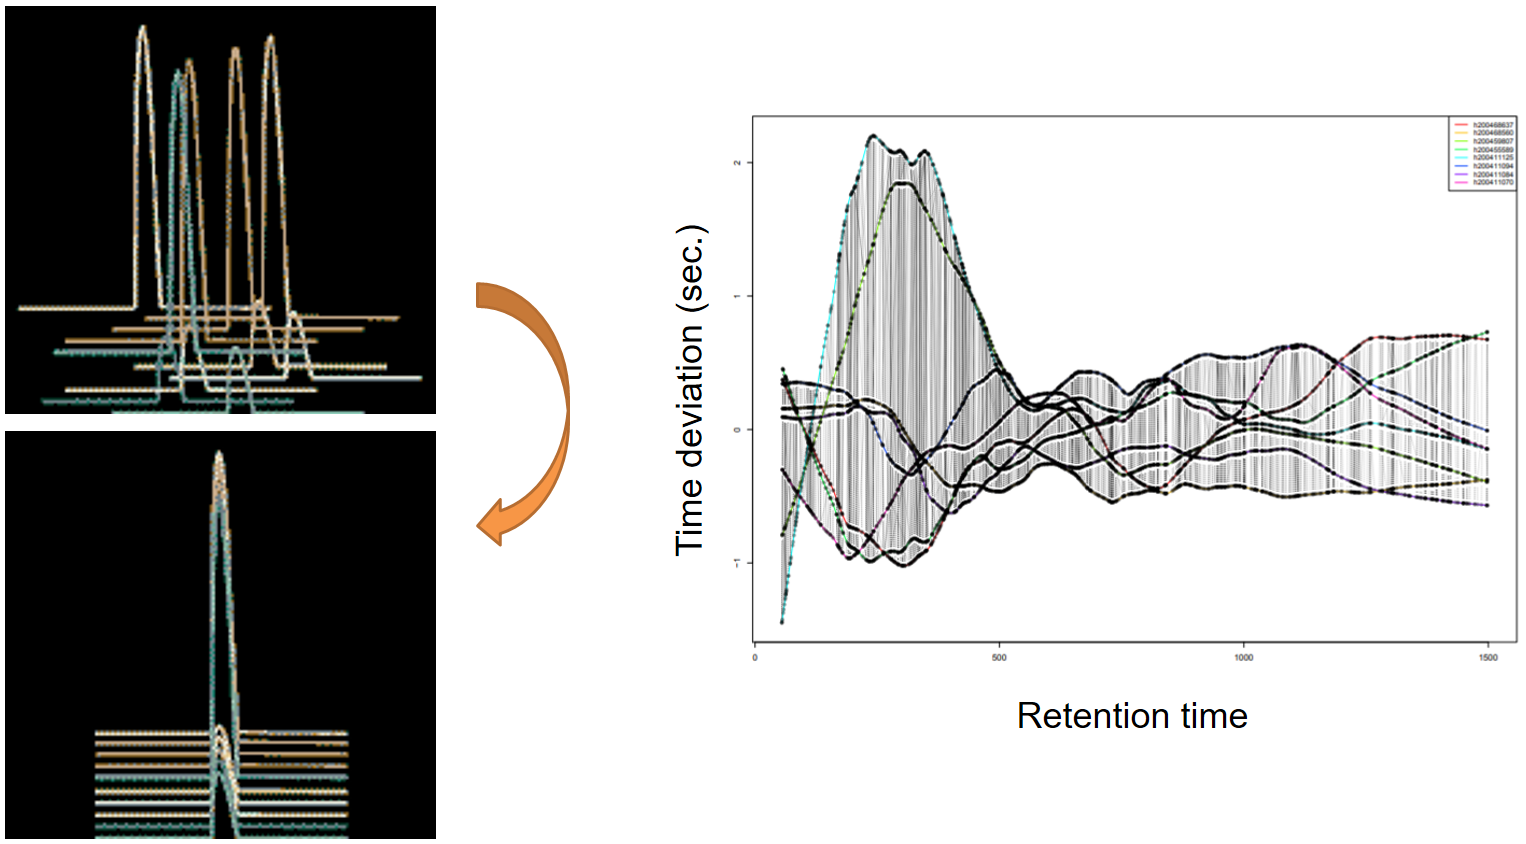
xcms - adjustRtime - PeakGroups algorithm
xcms - adjustRtime - PeakGroups - Parameters summary
| xcms parameters | related to | description | examples |
|---|---|---|---|
| smooth method | retention time | Regression model to model time deviation among samples (linear or loess). | linear or loess |
| span | Degree of smoothing of the loess model. | 0.2 to 1 | |
| extraPeaks | samples | Number of “extra” peaks used to define reference peaks (or well-behaved peaks) for modeling time deviation. Number of Peaks > number of samples. | default=1 |
| minFraction (previously missing) | samples | Minimum proportion of samples with reference peaks. If blank samples are used, minFraction < (1 - proportion of blanks). | 1 - proportion of blank samples |
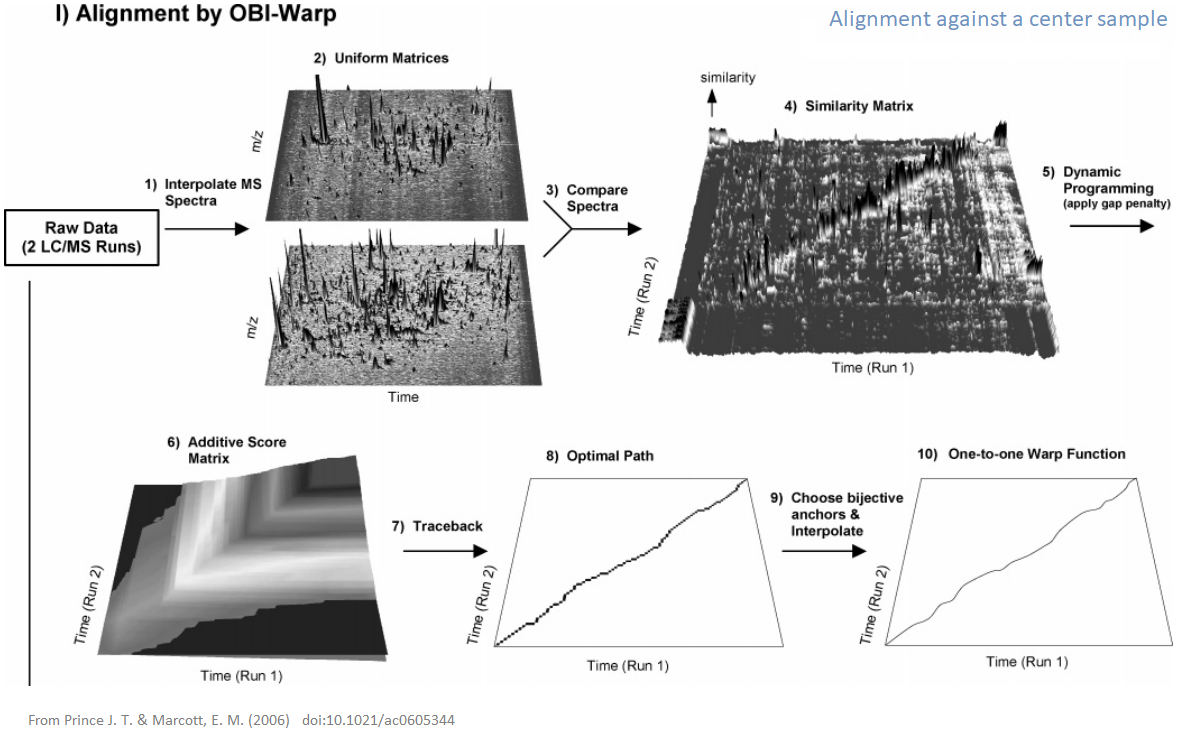
xcms - adjustRtime - Obiwrap algorithm
beforeafterrt
xcms - adjustRtime - Output
fillchrompeaks
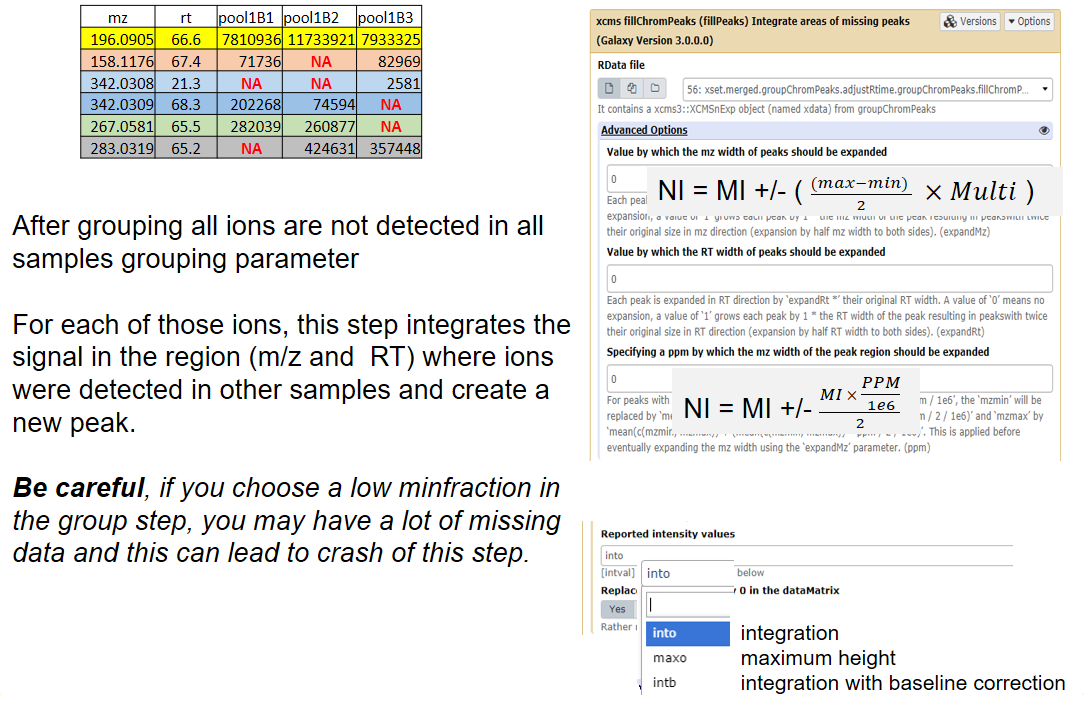
xcms - fillChromPeaks
Thank you!
This material is the result of a collaborative work. Thanks to the Galaxy Training Network and all the contributors! Tutorial Content is licensed under
Creative Commons Attribution 4.0 International License.
Tutorial Content is licensed under
Creative Commons Attribution 4.0 International License.