Mapping
OverviewQuestions:
Objectives:
What is mapping?
What two things are crucial for a correct mapping?
What is BAM?
Requirements:
Run a tool to map reads to a reference genome
Explain what is a BAM file and what it contains
Use genome browser to understand your data
- Introduction to Galaxy Analyses
- Sequence analysis
- Quality Control: slides slides - tutorial hands-on
Time estimation: 1 hourLevel: Introductory IntroductorySupporting Materials:Published: Oct 4, 2016Last modification: Apr 9, 2024License: Tutorial Content is licensed under Creative Commons Attribution 4.0 International License. The GTN Framework is licensed under MITpurl PURL: https://gxy.io/GTN:T00237rating Rating: 4.3 (10 recent ratings, 75 all time)version Revision: 55
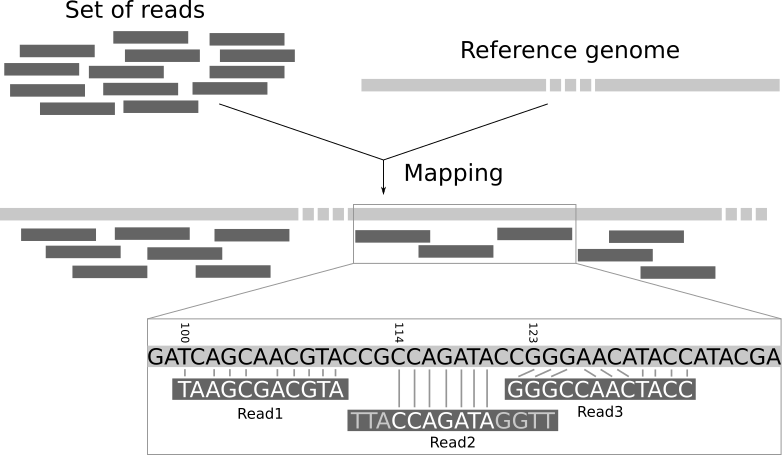
Sequencing produces a collection of sequences without genomic context. We do not know to which part of the genome the sequences correspond to. Mapping the reads of an experiment to a reference genome is a key step in modern genomic data analysis. With the mapping the reads are assigned to a specific location in the genome and insights like the expression level of genes can be gained.
The reads do not come with position information, so we do not know what part of the genome they came from. We need to use the sequence of the read itself to find the corresponding region in the reference sequence. But the reference sequence can be quite long (~3 billion bases for human), making it a daunting task to find a matching region. Since our reads are short, there may be several, equally likely places in the reference sequence from which they could have been read. This is especially true for repetitive regions.
In principle, we could do a BLAST analysis to figure out where the sequenced pieces fit best in the known genome. We would need to do that for each of the millions of reads in our sequencing data. Aligning millions of short sequences this way may, however, take a couple of weeks. And we do not care about the exact base to base correspondence (alignment). What we are interested in is “where these reads came from”. This approach is called mapping.
In the following, we will process a dataset with the mapper Bowtie2 and we will visualize the data with the program IGV.
AgendaIn this tutorial, we will deal with:
Prepare the data
Hands-on: Data upload
Create a new history for this tutorial and give it a proper name
Click the new-history icon at the top of the history panel:
- Click on galaxy-pencil (Edit) next to the history name (which by default is “Unnamed history”)
- Type the new name
- Click on Save
If you do not have the galaxy-pencil (Edit) next to the history name:
- Click on Unnamed history (or the current name of the history) (Click to rename history) at the top of your history panel
- Type the new name
- Press Enter
Import
wt_H3K4me3_read1.fastq.gzandwt_H3K4me3_read2.fastq.gzfrom Zenodo or from the data library (ask your instructor)https://zenodo.org/record/1324070/files/wt_H3K4me3_read1.fastq.gz https://zenodo.org/record/1324070/files/wt_H3K4me3_read2.fastq.gz
- Copy the link location
Click galaxy-upload Upload Data at the top of the tool panel
- Select galaxy-wf-edit Paste/Fetch Data
Paste the link(s) into the text field
Press Start
- Close the window
As an alternative to uploading the data from a URL or your computer, the files may also have been made available from a shared data library:
- Go into Shared data (top panel) then Data libraries
- Navigate to the correct folder as indicated by your instructor.
- On most Galaxies tutorial data will be provided in a folder named GTN - Material –> Topic Name -> Tutorial Name.
- Select the desired files
- Click on Add to History galaxy-dropdown near the top and select as Datasets from the dropdown menu
In the pop-up window, choose
- “Select history”: the history you want to import the data to (or create a new one)
- Click on Import
As default, Galaxy takes the link as name, so rename them.
Rename the files to
reads_1andreads_2
- Click on the galaxy-pencil pencil icon for the dataset to edit its attributes
- In the central panel, change the Name field
- Click the Save button

We just imported in Galaxy FASTQ files corresponding to paired-end data as we could get directly from a sequencing facility.
During sequencing, errors are introduced, such as incorrect nucleotides being called. Sequencing errors might bias the analysis and can lead to a misinterpretation of the data. The first step for any type of sequencing data is always to check their quality.
There is a dedicated tutorial for quality control of sequencing data. We will not repeat the steps there. You should follow the tutorial and apply it to your data before going further.
Map reads on a reference genome
Read mapping is the process to align the reads on a reference genomes. A mapper takes as input a reference genome and a set of reads. Its aim is to align each read in the set of reads on the reference genome, allowing mismatches, indels and clipping of some short fragments on the two ends of the reads:
 Open image in new tab
We need a reference genome to map the reads on.
Question
- What is a reference genome?
- For each model organism, several possible reference genomes may be available (e.g.
hg19andhg38for human). What do they correspond to?- Which reference genome should we use?
- A reference genome (or reference assembly) is a set of nucleic acid sequences assembled as a representative example of a species’ genetic material. As they are often assembled from the sequencing of different individuals, they do not accurately represent the set of genes of any single organism, but a mosaic of different nucleic acid sequences from each individual.
- As the cost of DNA sequencing falls, and new full genome sequencing technologies emerge, more genome sequences continue to be generated. Using these new sequences, new alignments are built and the reference genomes improved (fewer gaps, fixed misrepresentations in the sequence, etc). The different reference genomes correspond to the different released versions (called “builds”).
- This data comes from the ChIP-seq of mice, so we will use mm10 (Mus musculus).
Currently, there are over 60 different mappers, and their number is growing. In this tutorial, we will use Bowtie2, a fast and memory-efficient open-source tool particularly good at aligning sequencing reads of about 50 up to 1,000s of bases to relatively long genomes.
Hands-on: Mapping with Bowtie2
- Bowtie2 ( Galaxy version 2.4.2+galaxy0) with the following parameters
- “Is this single or paired library”:
Paired-end
- param-file “FASTA/Q file #1”:
reads_1- param-file “FASTA/Q file #2”:
reads_2“Do you want to set paired-end options?”:
NoYou should have a look at the parameters there, specially the mate orientation if you know it. They can improve the quality of the paired-end mapping.
- “Will you select a reference genome from your history or use a built-in index?”:
Use a built-in genome index
- “Select reference genome”:
Mouse (Mus musculus): mm10“Select analysis mode”:
Default setting onlyYou should have a look at the non default parameters and try to understand them. They can have an impact on the mapping and improving it.
- “Save the bowtie2 mapping statistics to the history”:
Yes- Inspect the
mapping statsfile by clicking on the galaxy-eye (eye) icon
Question
- What information is provided here?
- How many reads have been mapped exactly 1 time?
- How many reads have been mapped more than 1 time? How is it possible? What should we do with them?
- How many pair of reads have not been mapped? What are the causes?
- The information given here is a quantity one. We can see how many sequences are aligned. It does not tell us something about the quality.
- ~90% reads have been aligned exactly 1 time
- ~7% reads have been aligned concordantly >1 times. These are called multi-mapped reads. It can happen because of repetitions in the reference genome (multiple copies of a gene for example), particularly when the reads are small. It is difficult to decide where these sequences come from and therefore most of the pipelines ignore them. Always check the statistics there to be sure of not discarding too much information in any downstream analyses.
- ~3% pair of reads have not been mapped because
- both reads in the pair aligned but their positions do not concord with pair of reads (
aligned discordantly 1 time)- reads of these pairs are multi-mapped (
aligned >1 timesinpairs aligned 0 times concordantly or discordantly)- one read of these pairs are mapped but not the paired read (
aligned exactly 1 timeinpairs aligned 0 times concordantly or discordantly)- the rest are not mapped at all
Checking the mapping statistics is an important step to do before continuing any analyses. There are several potential sources for errors in mapping, including (but not limited to):
- Polymerase Chain Reaction (PCR) artifacts: Many high-throughput sequencing (HTS) methods involve one or multiple PCR steps. PCR errors will show as mismatches in the alignment, and especially errors in early PCR rounds will show up in multiple reads, falsely suggesting genetic variation in the sample. A related error would be PCR duplicates, where the same read pair occurs multiple times, skewing coverage calculations in the alignment.
- Sequencing errors: The sequencing machine can make an erroneous call either for physical reasons (e.g. oil on an Illumina slide) or due to properties of the sequenced DNA (e.g., homopolymers). As sequencing errors are often random, they can be filtered out as singleton reads during variant calling.
- Mapping errors: The mapping algorithm can map a read to the wrong location in the reference. This often happens around repeats or other low-complexity regions.
So if the mapping statistics are not good, you should investigate the cause of these errors before going further in your analyses.
After that, you should have a look at the reads and inspect the BAM file where the read mappings are stored.
Inspection of a BAM file
A BAM (Binary Alignment Map) file is a compressed binary file storing the read sequences, whether they have been aligned to a reference sequence (e.g. a chromosome), and if so, the position on the reference sequence at which they have been aligned.
Hands-on: Inspect a BAM/SAM file
- Inspect the param-file output of Bowtie2 tool
A BAM file (or a SAM file, the non-compressed version) consists of:
- A header section (the lines starting with
@) containing metadata particularly the chromosome names and lengths (lines starting with the@SQsymbol) -
An alignment section consisting of a table with 11 mandatory fields, as well as a variable number of optional fields:
Col Field Type Brief Description 1 QNAME String Query template NAME 2 FLAG Integer Bitwise FLAG 3 RNAME String References sequence NAME 4 POS Integer 1- based leftmost mapping POSition 5 MAPQ Integer MAPping Quality 6 CIGAR String CIGAR String 7 RNEXT String Ref. name of the mate/next read 8 PNEXT Integer Position of the mate/next read 9 TLEN Integer Observed Template LENgth 10 SEQ String Segment SEQuence 11 QUAL String ASCII of Phred-scaled base QUALity+33
Question
- Which information do you find in a SAM/BAM file?
- What is the additional information compared to a FASTQ file?
- Sequences and quality information, like a FASTQ
- Mapping information, Location of the read on the chromosome, Mapping quality, etc
The BAM file includes a lot of information about each read, particularly the quality of mapping.
Hands-on: Summary of mapping quality
- Samtools Stats ( Galaxy version 2.0.2+galaxy2) with the following parameters
- param-file “BAM file”:
aligned reads(output of Bowtie2 tool)- “Use reference sequence”:
Locally cached/Use a built-in genome
- “Using genome”:
Mouse (Mus musculus): mm10 Full- Inspect the param-file
Statsfile
Question
- What is the proportion of mismatches in the mapped reads when aligned to the reference genome?
- What does the error rate represent?
- What is the average quality? How is it represented?
- What is the insert size average?
- How many reads have a mapping quality score below 20?
- There are ~21,900 mismatches for ~4,753,900 bases mapped which on average produces ~0.005 mismatches per mapped bases.
- The error rate is the proportion of mismatches per mapped bases, so the ratio computed right before.
- The average quality is the mean quality score of the mapping. It is a Phred score like the one used in the FASTQ file for each nucleotide. But here the score is not per nucleotide, but per read and it represents the probability of mapping quality.
- The insert size is the distance between the two reads in the pairs.
- To get the info:
- Filter BAM ( Galaxy version 2.5.2+galaxy2) with a filter to keep only the reads with a mapping quality >= 20
- Samtools Stats ( Galaxy version 2.0.5) on the output of Filter
Before filtering: 95,412 reads and after filtering: 89,664 reads.
Visualization using a Genome Browser
IGV
The Integrative Genomics Viewer (IGV) is a high-performance visualization tool for interactive exploration of large, integrated genomic datasets. It supports a wide variety of data types, including array-based and next-generation sequence data, and genomic annotations. In the following, we will use it to visualize the mapped reads.
Hands-on: Visualization of the reads in IGVThere are two ways to run it:
- If you have IGV installed (or want to install it):
- Install IGV
- Launch IGV on your computer
- Expand the param-file output of Bowtie2 tool
- Click on the
localindisplay with IGVto load the reads into the IGV browser- If you do not have IGV
- Click on the
Mouse mm10(or correct organism) indisplay with IGVto load the reads into the IGV browser- Zoom on the
chr2:98,666,236-98,667,473
The reads have a direction: they are mapped to the forward or reverse strand, respectively. When hovering over a read, extra information is displayed
Question
- What could it mean if a bar in the coverage view is colored?
- What could be the reason why a read is white instead of grey?
- If a nucleotide differs from the reference sequence in more than 20% of quality weighted reads, IGV colors the bar in proportion to the read count of each base.
- They have a mapping quality equal to zero. Interpretation of this mapping quality depends on the mapping aligner as some commonly used aligners use this convention to mark a read with multiple alignments. In such a case, the read also maps to another location with equally good placement. It is also possible that the read could not be uniquely placed but the other placements do not necessarily give equally good quality hits.
Comment: Tips for IGV
- Because the number of reads over a region can be quite large, the IGV browser by default only displays the reads that fall into a small window. This behaviour can be changed in the IGV from
view > Preferences > Alignments.If the genome of your interest is not there check if it is available via More…. If this is not the case, you can add it manually via the menu Genomes -> Load Genome from…
A general description of the user interface of the IGV browser is available here: IGV Browser description

JBrowse
JBrowse ( Galaxy version 1.16.11+galaxy0) is an alternative, web-based genome browser. Whereas IGV is a piece of software you must download and run, JBrowse instances are websites hosted online that provide an interface to browse genomics data. We’ll use it to visualise the mapped reads.
Hands-on: Visualization of the reads in JBrowse
- JBrowse ( Galaxy version 1.16.11+galaxy1) browser, with the following parameters:
- “Reference genome to display”: Use a built-in genome
- “Select a reference genome”:
mm10- “JBrowse-in-Galaxy Action”:
New JBrowse Instance- “Insert Track Group”:
- “Insert Annotation Track”:
- “Track Type”: BAM Pileups
- “BAM Track Data”:
aligned reads(output of Bowtie2 tool)- “Autogenerate SNP Track”: Yes
- “Track Visibility”: On for new users
- Visualise the dataset galaxy-eye
- Zoom on the
chr2:98,666,236-98,667,473
Comment: SlowThis can take about a minute or two to run, depending on your training instance’s resources. It takes time as the server builds up a small website for you, and pre-processes the reference genome into a more efficient format. If you wanted to share this with your colleagues, you could download this dataset and directly place it on your webserver.
The reads have a direction: they are mapped to the forward or reverse strand, respectively. When clicking on a read, extra information is displayed
Question
- What do the teardrop shape and line mean in the autogenerated SNP track?
- What do differently coloured reads mean?
- If enough reads have a different value, then it is marked with a teardrop icon. The coverage plot is marked in height with the percentage of reads with a different call at that position
Colour Codes:
Colour Meaning Original red Forward strand Original blue Reverse strand Hard red Forward strand, missing mate Hard Blue Reverse strand, missing mate Light red Forward strand not proper Light blue Reverse strand, not proper Black Forward, diff chr Grey Reverse, diff chr Grey No strand
Conclusion
After quality control, mapping is an important step of most analyses of sequencing data (RNA-Seq, ChIP-Seq, etc) to determine where in the genome our reads originated from and use this information for downstream analyses.
Key points
Know your data!
Mapping is not trivial
There are many mapping algorithms, it depends on your data which one to choose
Frequently Asked Questions
Have questions about this tutorial? Check out the tutorial FAQ page or the FAQ page for the Sequence analysis topic to see if your question is listed there. If not, please ask your question on the GTN Gitter Channel or the Galaxy Help ForumUseful literature
Further information, including links to documentation and original publications, regarding the tools, analysis techniques and the interpretation of results described in this tutorial can be found here.
Feedback
Did you use this material as an instructor? Feel free to give us feedback on how it went.
Did you use this material as a learner or student? Click the form below to leave feedback.
Citing this Tutorial
- Joachim Wolff, Bérénice Batut, Helena Rasche, Mapping (Galaxy Training Materials). https://training.galaxyproject.org/training-material/topics/sequence-analysis/tutorials/mapping/tutorial.html Online; accessed TODAY
- Hiltemann, Saskia, Rasche, Helena et al., 2023 Galaxy Training: A Powerful Framework for Teaching! PLOS Computational Biology 10.1371/journal.pcbi.1010752
- Batut et al., 2018 Community-Driven Data Analysis Training for Biology Cell Systems 10.1016/j.cels.2018.05.012
Congratulations on successfully completing this tutorial!@misc{sequence-analysis-mapping, author = "Joachim Wolff and Bérénice Batut and Helena Rasche", title = "Mapping (Galaxy Training Materials)", year = "", month = "", day = "" url = "\url{https://training.galaxyproject.org/training-material/topics/sequence-analysis/tutorials/mapping/tutorial.html}", note = "[Online; accessed TODAY]" } @article{Hiltemann_2023, doi = {10.1371/journal.pcbi.1010752}, url = {https://doi.org/10.1371%2Fjournal.pcbi.1010752}, year = 2023, month = {jan}, publisher = {Public Library of Science ({PLoS})}, volume = {19}, number = {1}, pages = {e1010752}, author = {Saskia Hiltemann and Helena Rasche and Simon Gladman and Hans-Rudolf Hotz and Delphine Larivi{\`{e}}re and Daniel Blankenberg and Pratik D. Jagtap and Thomas Wollmann and Anthony Bretaudeau and Nadia Gou{\'{e}} and Timothy J. Griffin and Coline Royaux and Yvan Le Bras and Subina Mehta and Anna Syme and Frederik Coppens and Bert Droesbeke and Nicola Soranzo and Wendi Bacon and Fotis Psomopoulos and Crist{\'{o}}bal Gallardo-Alba and John Davis and Melanie Christine Föll and Matthias Fahrner and Maria A. Doyle and Beatriz Serrano-Solano and Anne Claire Fouilloux and Peter van Heusden and Wolfgang Maier and Dave Clements and Florian Heyl and Björn Grüning and B{\'{e}}r{\'{e}}nice Batut and}, editor = {Francis Ouellette}, title = {Galaxy Training: A powerful framework for teaching!}, journal = {PLoS Comput Biol} Computational Biology} }
Go FurtherDo you want to extend your knowledge? Follow one of our recommended follow-up trainings:
- Transcriptomics
- Reference-based RNA-Seq data analysis: tutorial hands-on
- Epigenetics
- Formation of the Super-Structures on the Inactive X: slides slides - tutorial hands-on
You can use Ephemeris's
shed-tools installcommand to install the tools used in this tutorial.shed-tools install [-g GALAXY] [-a API_KEY] -t <(curl https://training.galaxyproject.org/training-material/api/topics/sequence-analysis/tutorials/mapping/tutorial.json | jq .admin_install_yaml -r)Alternatively you can copy and paste the following YAML
---
install_tool_dependencies: true
install_repository_dependencies: true
install_resolver_dependencies: true
tools:
- name: trim_galore
  owner: bgruening
  revisions: 949f01671246
  tool_panel_section_label: FASTA/FASTQ
  tool_shed_url: https://toolshed.g2.bx.psu.edu/
- name: bamtools_filter
  owner: devteam
  revisions: cb20f99fd45b
  tool_panel_section_label: SAM/BAM
  tool_shed_url: https://toolshed.g2.bx.psu.edu/
- name: bamtools_filter
  owner: devteam
  revisions: 993b19f20c76
  tool_panel_section_label: SAM/BAM
  tool_shed_url: https://toolshed.g2.bx.psu.edu/
- name: bowtie2
  owner: devteam
  revisions: a6d65b0c67af
  tool_panel_section_label: Mapping
  tool_shed_url: https://toolshed.g2.bx.psu.edu/
- name: fastqc
  owner: devteam
  revisions: e7b2202befea
  tool_panel_section_label: FASTA/FASTQ
  tool_shed_url: https://toolshed.g2.bx.psu.edu/
- name: samtools_stats
  owner: devteam
  revisions: 24c5d43cb545
  tool_panel_section_label: SAM/BAM
  tool_shed_url: https://toolshed.g2.bx.psu.edu/
- name: samtools_stats
  owner: devteam
  revisions: 145f6d74ff5e
  tool_panel_section_label: SAM/BAM
  tool_shed_url: https://toolshed.g2.bx.psu.edu/
- name: samtools_stats
  owner: devteam
  revisions: fed4aa48ba09
  tool_panel_section_label: SAM/BAM
  tool_shed_url: https://toolshed.g2.bx.psu.edu/
- name: jbrowse
  owner: iuc
  revisions: 1cfc579079a6
  tool_panel_section_label: Graph/Display Data
  tool_shed_url: https://toolshed.g2.bx.psu.edu/
- name: jbrowse
  owner: iuc
  revisions: 4542035c1075
  tool_panel_section_label: Graph/Display Data
  tool_shed_url: https://toolshed.g2.bx.psu.edu/
- name: multiqc
  owner: iuc
  revisions: c1a4b5f3b432
  tool_panel_section_label: Quality Control
  tool_shed_url: https://toolshed.g2.bx.psu.edu/
- name: multiqc
  owner: iuc
  revisions: 75c93c70d094
  tool_panel_section_label: Quality Control
  tool_shed_url: https://toolshed.g2.bx.psu.edu/